
 Watch
Watch We’ve covered a significant portion of this course by now. Looking back, we’ve already discussed indicators based on candlesticks or patterns to identify trend reversals.
Let’s list out some of the indicators of change in trend:
- Double top and bottoms
- Island reversals
- Head and shoulders
- Rising and falling wedges
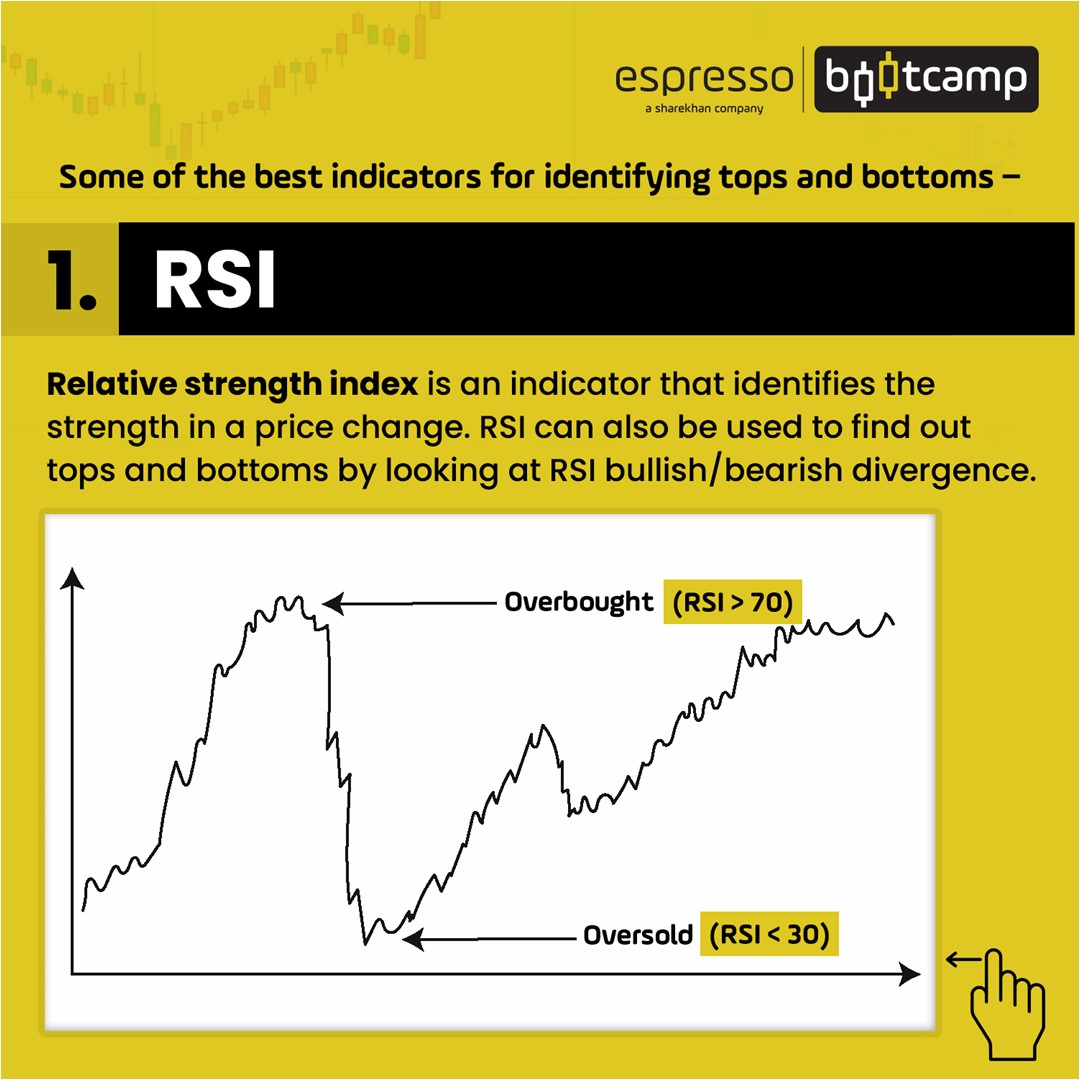
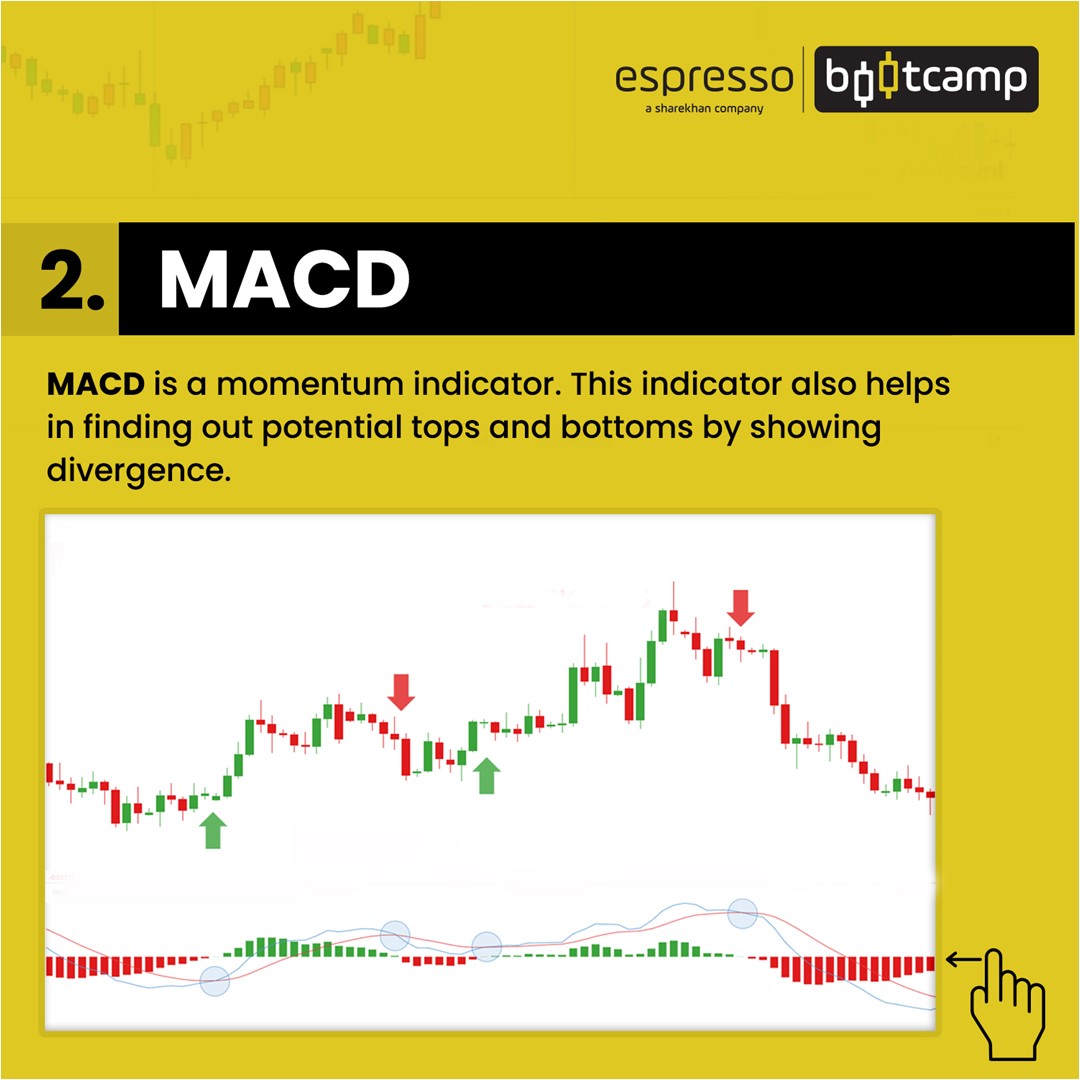
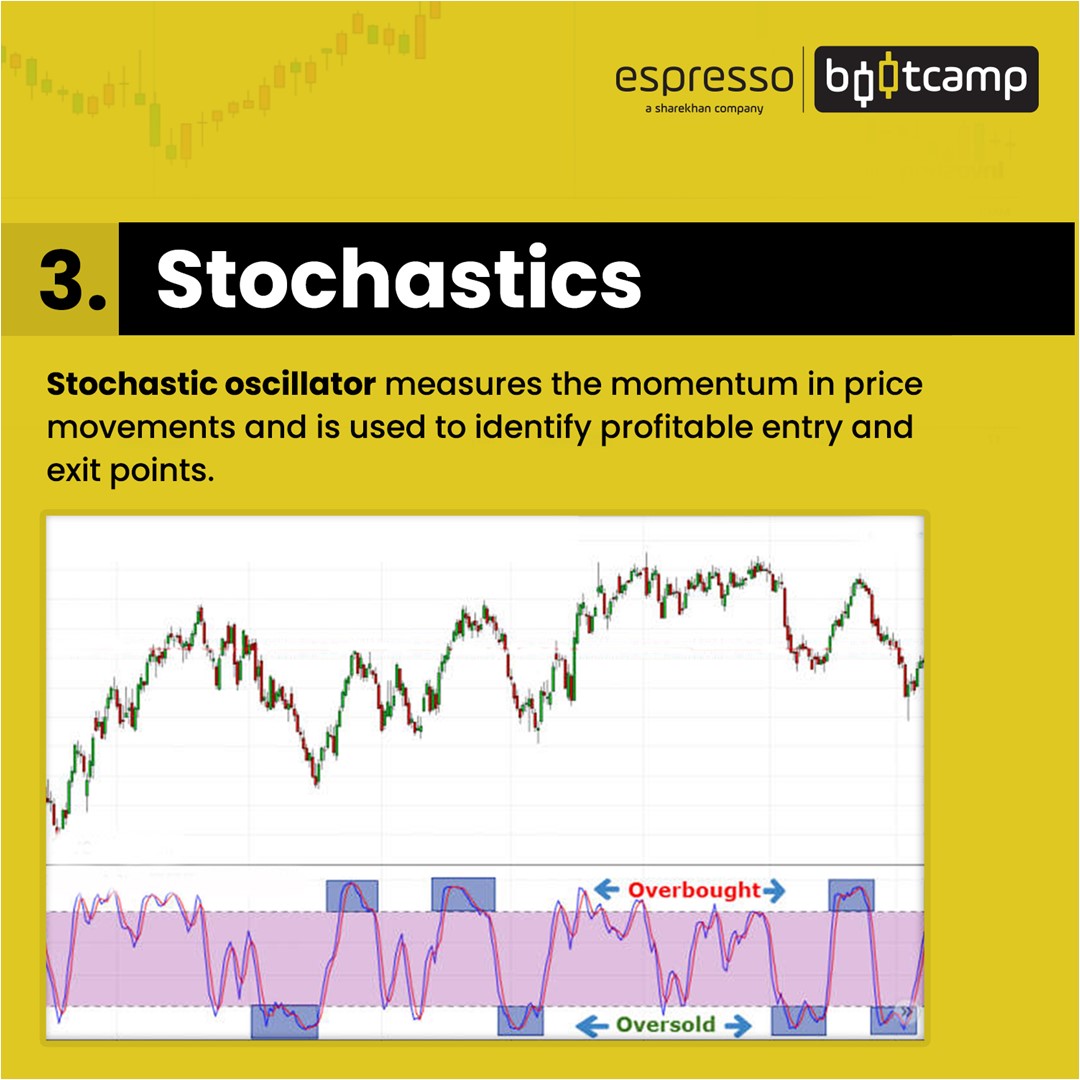
What about oscillators that help identify reversals?
Traders use both price and momentum indicators to have an edge rather than use them individually. When price and momentum indicators converge, a trend or momentum reversal is confirmed. However, at times when one of them does not confirm, then there is a divergence. Divergence is a signal of a trend reversal. If understood properly, divergence can be used to identify and trade reversals correctly.
Meaning of divergence
Divergence simply means how prices behave differently or distinctively from the indicators.
For example, when a price pattern seems to point to a top or a bottom, but the indicator points out that it is not, then it is a divergence. Any indicator like RSI, MACD, Stochastic or any other preferred oscillator can be used. Even though most of the indicators are lagging, they are useful in giving leading signals in divergence.
Divergence should be observed in a higher timeframe like half an hour, one hour or two hours or a daily time frame. Smaller timeframes may give more signals, but they may be not reliable.
How to identify divergence
Divergences are difficult to identify charts. While some practice is needed, it is not so difficult to learn. Basic knowledge of charting should be good enough. The most important thing in this is the ability to identify trends, bottoms and tops. Trendlines are drawn connecting higher highs and higher lows and lower highs and lower lows. Double tops and double bottoms are some of the patterns that pinpoint reversals. Momentum indicators also point out a change in the pace of momentum and trend, leading to probable reversals.
Steps in identifying divergence
- Identify swing tops and bottoms on price charts
- Draw trendline connecting tops and bottoms on price charts
- Identify tops and bottoms on momentum indicators that are aligned with prices
- Draw trendlines connecting tops and bottoms on indicators
- Observe the slopes of price and indicators. If the slope is different, there is a divergence
These steps will help point out divergence when price trendlines differ from momentum trendlines.
Types of divergence
There are typically classified as divergence and hidden divergence - both indicate bullish and bearish scenarios.
Divergence
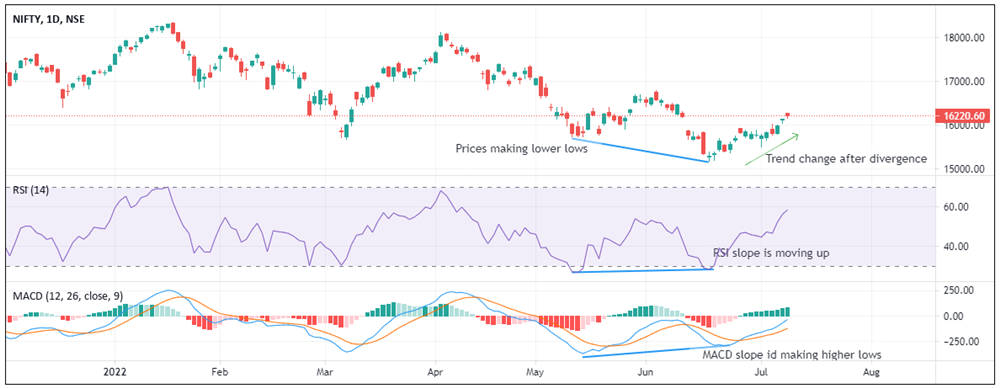
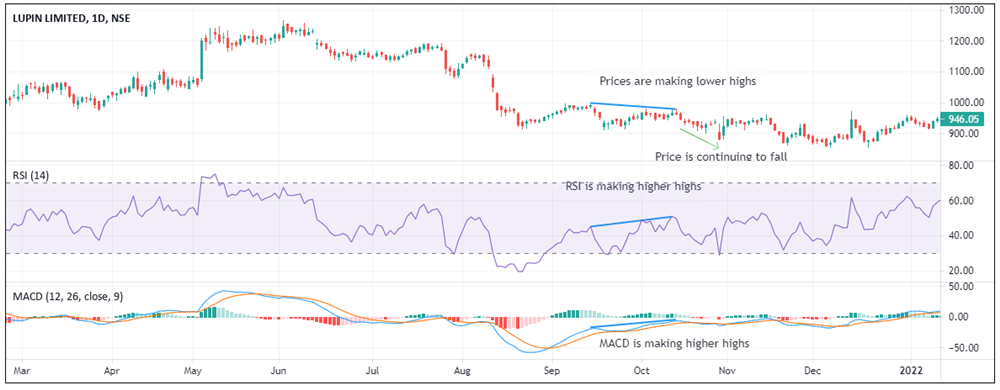
Bullish divergence is formed when the prices are forming lower lows and have been trending low for some time, while the momentum indicator is forming higher lows, indicating a bottom or a change in trend.
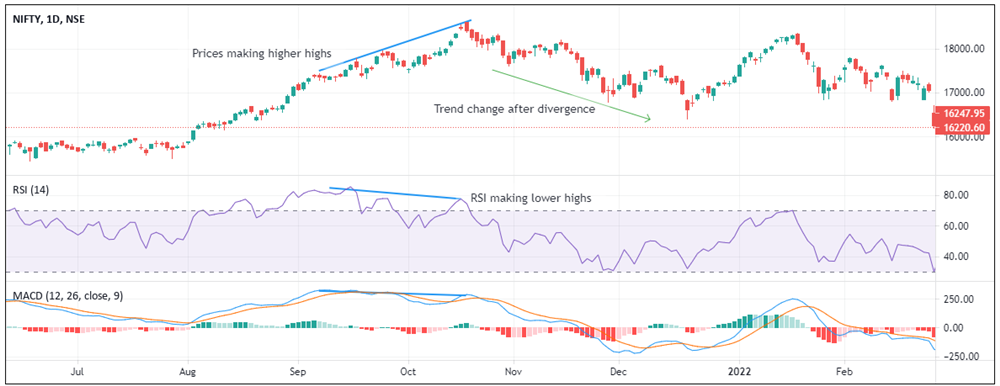
Bearish divergence is formed when prices are making higher highs and have been trending for a period, while the momentum indicators are making lower highs, indicating a top or a change in trend.
Hidden Divergence
Hidden divergence helps in identifying possible trend continuation. This divergence can be seen when there is a pullback of an existing trend, but it holds up and does not break the previous up or downswing. While the price is holding up, the momentum indicators continue in the opposite direction.
Bullish hidden divergence happens when the prices form higher lows, indicating an uptrend. However, a pullback happens, but the prices are not breaking the previous swing low, and the momentum indicators are forming lower lows, indicating an opposite reaction. When a bullish hidden divergence is formed, the trend will likely continue upwards.
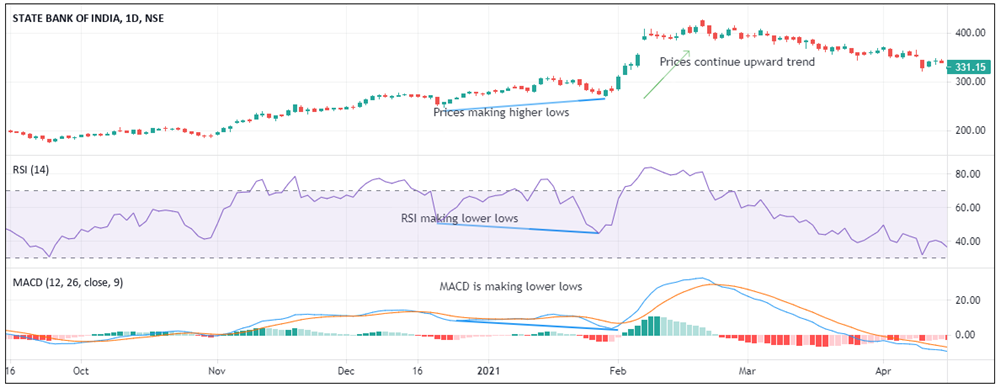
Bearish hidden divergence happens when the prices form lower highs, indicating a downtrend. However, a pullback happens, but the prices are not breaking the previous high, and the momentum indicators are forming higher highs, indicating the opposite reaction. When a bearish hidden divergence is spotted, the trend is most likely to continue downwards.
Points to remember
- Hidden divergences are not easy to spot
- If one does identify them, they need to be confirmed
- Pullback has to be completed if the trend has to continue
- Some of the ways of confirming a pullback are to check with other indicators like support and resistance or Fibonacci retracements or candle stick patterns, etc., and then plan a trade.
 0
|
0
|
 0
0

