
 Watch
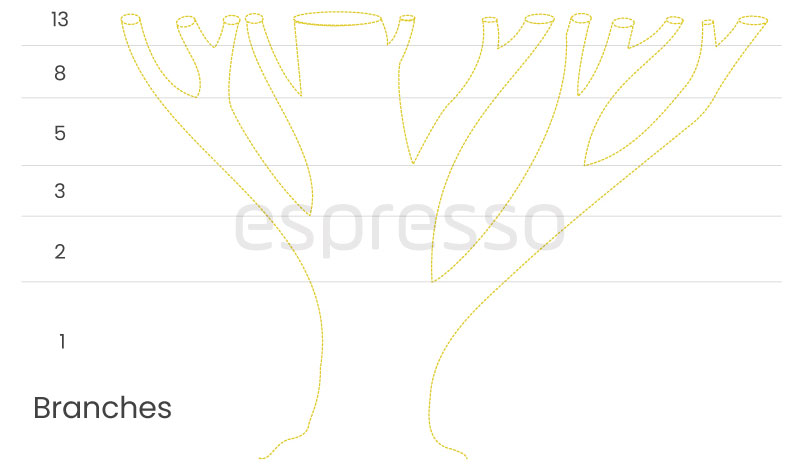
Watch What is common between lily, buttercup and daisy? Yes, they are different types of flowers. More than that, there is an interesting similarity between them. The number of petals in each of these flowers is a Fibonacci number! While lily has three petals, buttercups five and daisy 21! Such instances can be found in plenty in nature.

Though the Fibonacci number is named after the person who invented it (according to Western Scholars), it’s in fact, nature’s gift to mankind. Now let’s try to understand what the Fibonacci number is all about. Look at the following sequence: 0, 1, 1, 2, 3, 5, 8, 13, 21, 34, 55, 89, 144, and so on This is not a set of random numbers, but there is an order in the sequence. Here each number is arrived at by adding the immediately preceding two numbers. For example, the number 8 is arrived at by adding its immediately preceding two numbers, that is, 3 and 5. Number 55 is arrived at by adding numbers 21 and 34. Thus, Fibonacci numbers are a series of numbers in which each number is arrived at by adding two preceding numbers.
So far, so good. Now, what’s the connection between these numbers and stock prices? A Fibonacci number in isolation may not have any utility for you in the stock market. It may be just a number, but that’s it. But a series of Fibonacci numbers are the subject of many mathematical studies and have given birth to many interesting theories and ratios. One such ratio is popularly known as the “Golden Ratio”, which is also known as Phi. Phi or the Golden Ratio, theoretically, which goes into infinity, is widely used in various arenas like architecture, art, sculptures, mathematics, physics, etc. Some of them have been found useful in stock chart studies.
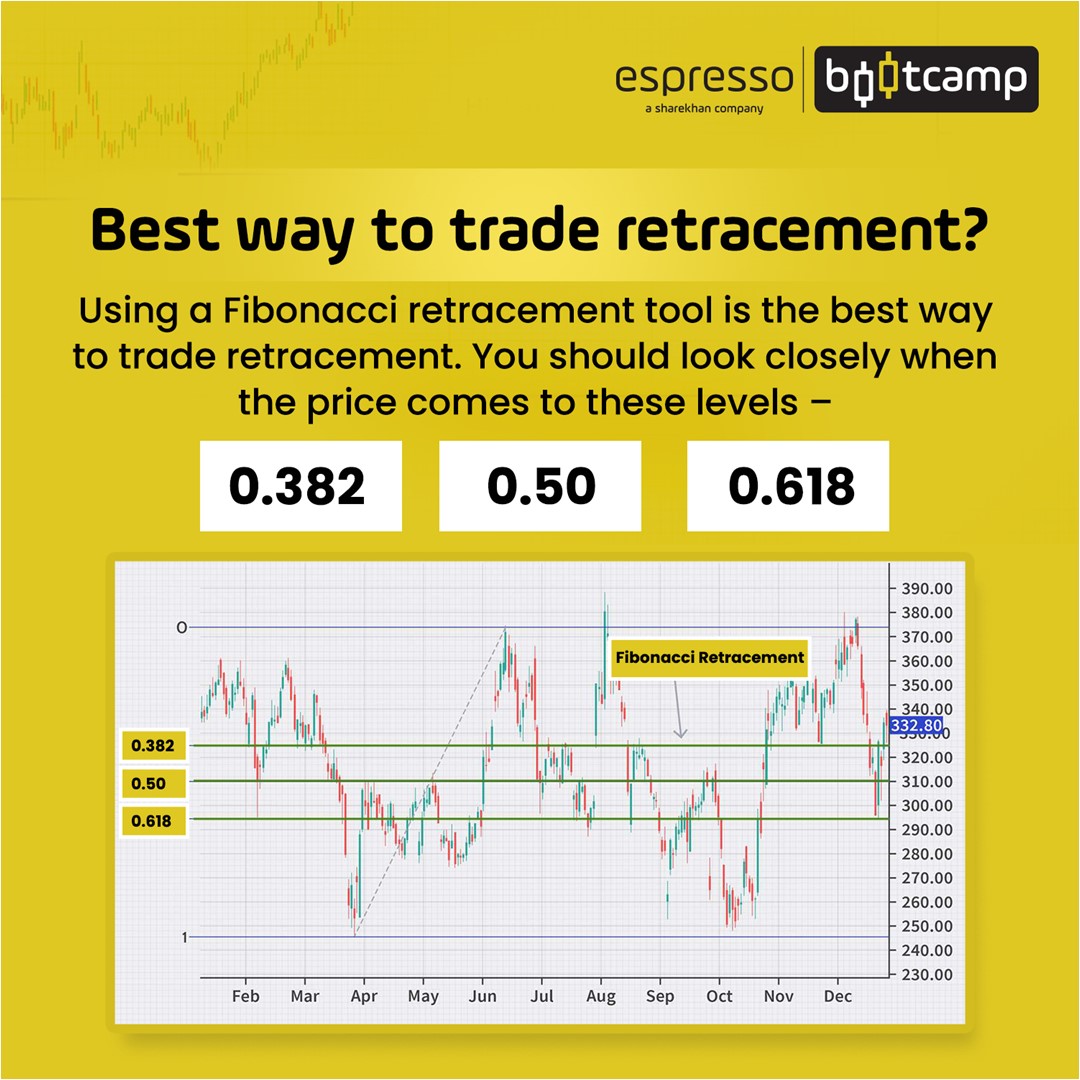
A Golden Ratio is derived by dividing any Fibonacci number by its previous number. In the above example, if we divide 55 by its preceding Fibonacci number, that is, 34, we get 1.618 which is Phi. On the other hand, by dividing 34 by 55, we get 0.618. Similarly, by dividing 34 by two Fibonacci numbers above it, that is, 89, we get 0.382. Similarly, you get a ratio of 0.236 by dividing a number in the series by a number 3 places higher. In the above example, divide 34 by 144 to get 0.236. When all these numbers are converted into percentages, you will get 61.8%, 38.2% and 23.6%. All these percentages, along with 50%, are proved to be good retracement levels at the time of stock price correction and are known as Fibonacci Retracement levels. So that's the Fibonacci retracement in stock market.
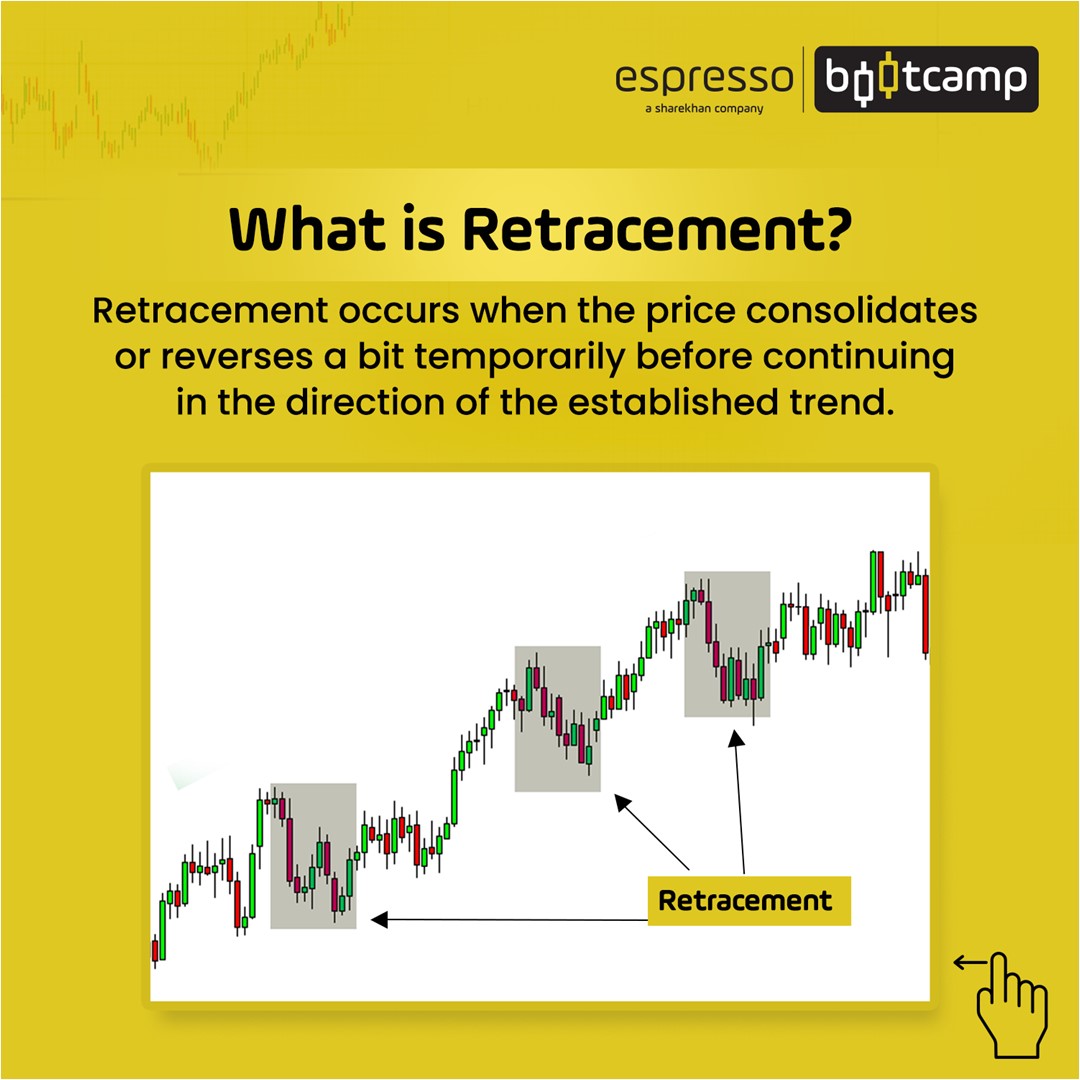
In almost all charting sites, you find an option to draw the Fibonacci retracement level. They may be known as Fibonacci Retracement, Fib Retracement, Price Retracement, etc. This technique is used to find out where the stock or Index may find support when it’s in a correction mode. A stock may correct slightly and then once again may start its up move or may lose 50% of its recent gain or even more, or it may give up all its gain in a recent up move. So, the retracement is always in relation to a recent up move. For this, therefore, we need to find out the exact range of up move. In other words, you need to mark the range from the foothill to the summit. So, after choosing the Fibonacci Retracement tool, take the cursor to the bottom of the up move and gradually move it to the top of the up move. This will automatically mark the range and will also give various retracement levels.
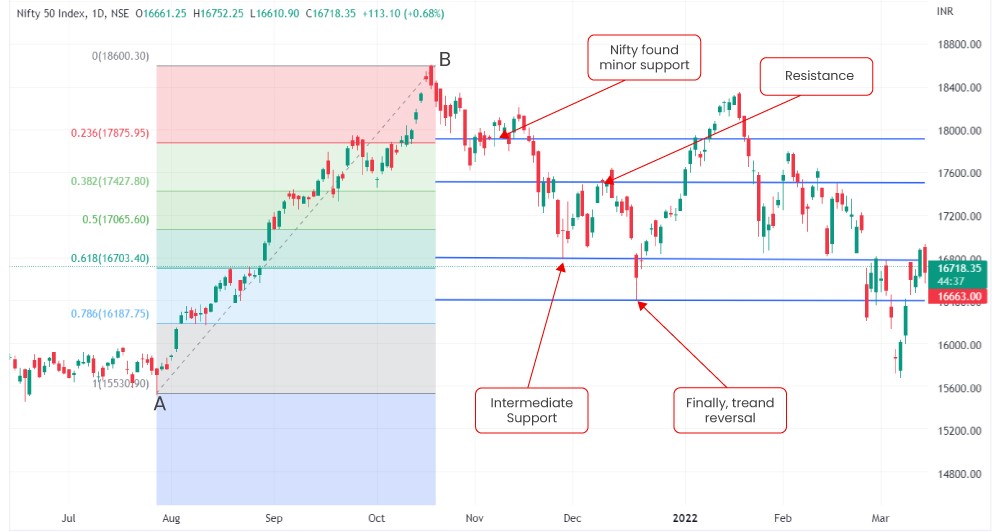
In the chart of Nifty 50 given above, the first lowest point from where the upmove started was identified (marked as A), and then the highest point of the upmove was marked (as B). Now the support for the index when it is correcting can be found by using Fibonacci ratios. Nifty first found support at around 23.6% (or 0.236) retracement, where it hovered around for quite some time before resuming its downward journey. Once again, it found support at around 61.8% retracement level from where it started moving upwards. However, the 38.2% retracement level acted as resistance, and the index once again reversed its trend. This time the index found support around the 78.6% retracement level, which reversed its declining trend and started moving upwards.
It should be noted that you may not find support and resistance exactly at the retracement level but somewhere around it. Also, there is no surety that these retracement levels always act as support and resistance levels. Therefore, it’s always better to use this technique along with other signals. With multiple support levels around, often it may confuse the trader/investor, who will be struggling to identify the exact levels. So, one must be very careful and should use this along with other tools.
Points to remember:
- Fibonacci sequence is obtained by adding two preceding numbers.
- The ratios and percentages obtained from the Fibonacci sequence are considered to be levels to which the price may retrace.
- In order to use the Fibonacci retracement tool, it is important to identify the lowest and highest points of a move.
- These levels may not always be accurate but provide a good estimate for support and resistance levels.
 0
|
0
|
 0
0

