
 Watch
Watch We close Module 4 with a study of trendlines, a widely and popularly used technical analysis tool.
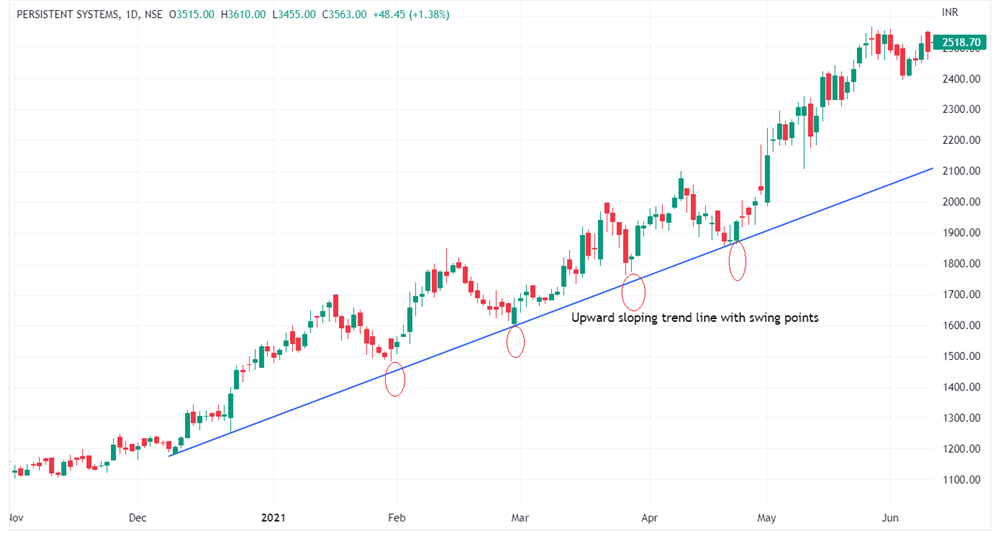
So what are trendlines in technical analysis? As the name indicates, trendlines are lines drawn between two or more swing points to identify the direction of the market or stock prices. Swing points are nothing but the major support or resistance zones.
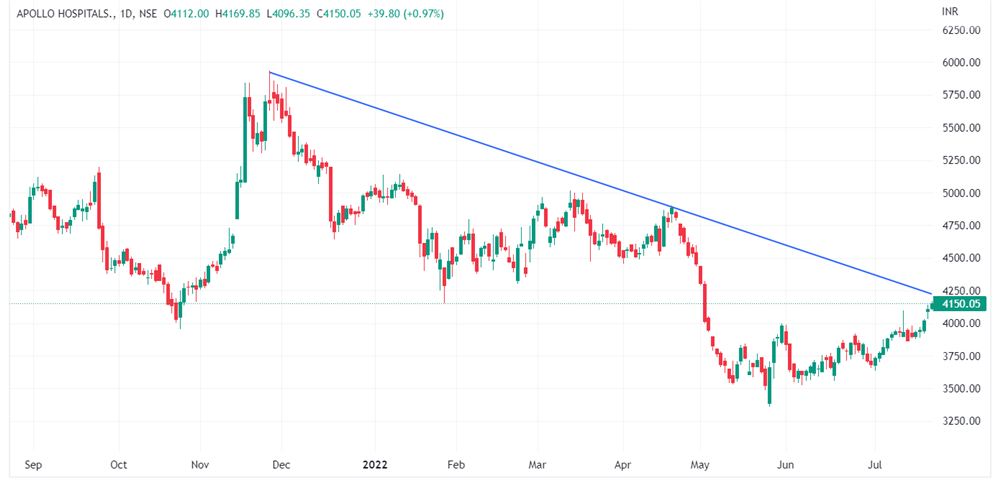
Trendlines in stock market are used to identify major support or resistance areas; however, they are not horizontal lines that are drawn to identify support or resistance areas. They are used to understand whether the prices are upward-sloping or downward-sloping. An upward-sloping trendline implies higher demand and a consequent increase in price. A downward-sloping trendline implies a higher supply and, consequently decrease in prices.
How to draw trendlines
- At least two swing points are required for drawing a trend line.
- An upward trending line is drawn by joining swing bottoms indicating possible support areas, while the downward trending line is drawn by joining swing highs indicating possible resistance areas.
- The first step is to identify a significant swing high or low thereafter, join this to another significant swing high or swing low. This is the most basic trend line.
- A trendline that has more than two touch points is said to be strong.
- If the touch points are greater than five, the chances of the trendline breaking increase significantly.
- Note that prices can overlap the trendlines, but it must not cut the body of the candle for it to be a valid trendline.
Angles of trendlines
These are used by traders to understand the strength of a trend. Traders use an angle between 30-45 degrees to assess the strength of a trend. There are technical analysis packages that provide this tool.
A higher degree of angle in an upward sloping trendline can be interpreted as demand being higher and resulting in higher prices. A lower degree of angle implies lower demand and lower price increases. A higher degree of angle in a down sloping trendline can be interpreted to mean a higher supply resulting in falling prices.
Trendline sloping up
Trendline sloping down
Timeframes for drawing trendlines
- It is always better to draw trendlines at higher timeframes.
- If one draws trendlines in higher timeframes, it becomes visible in lower timeframes.
- Therefore, they become easy to identify major support and resistance.
- Trendlines drawn on higher timeframes are more reliable.
Different types of trendlines and how to trade them
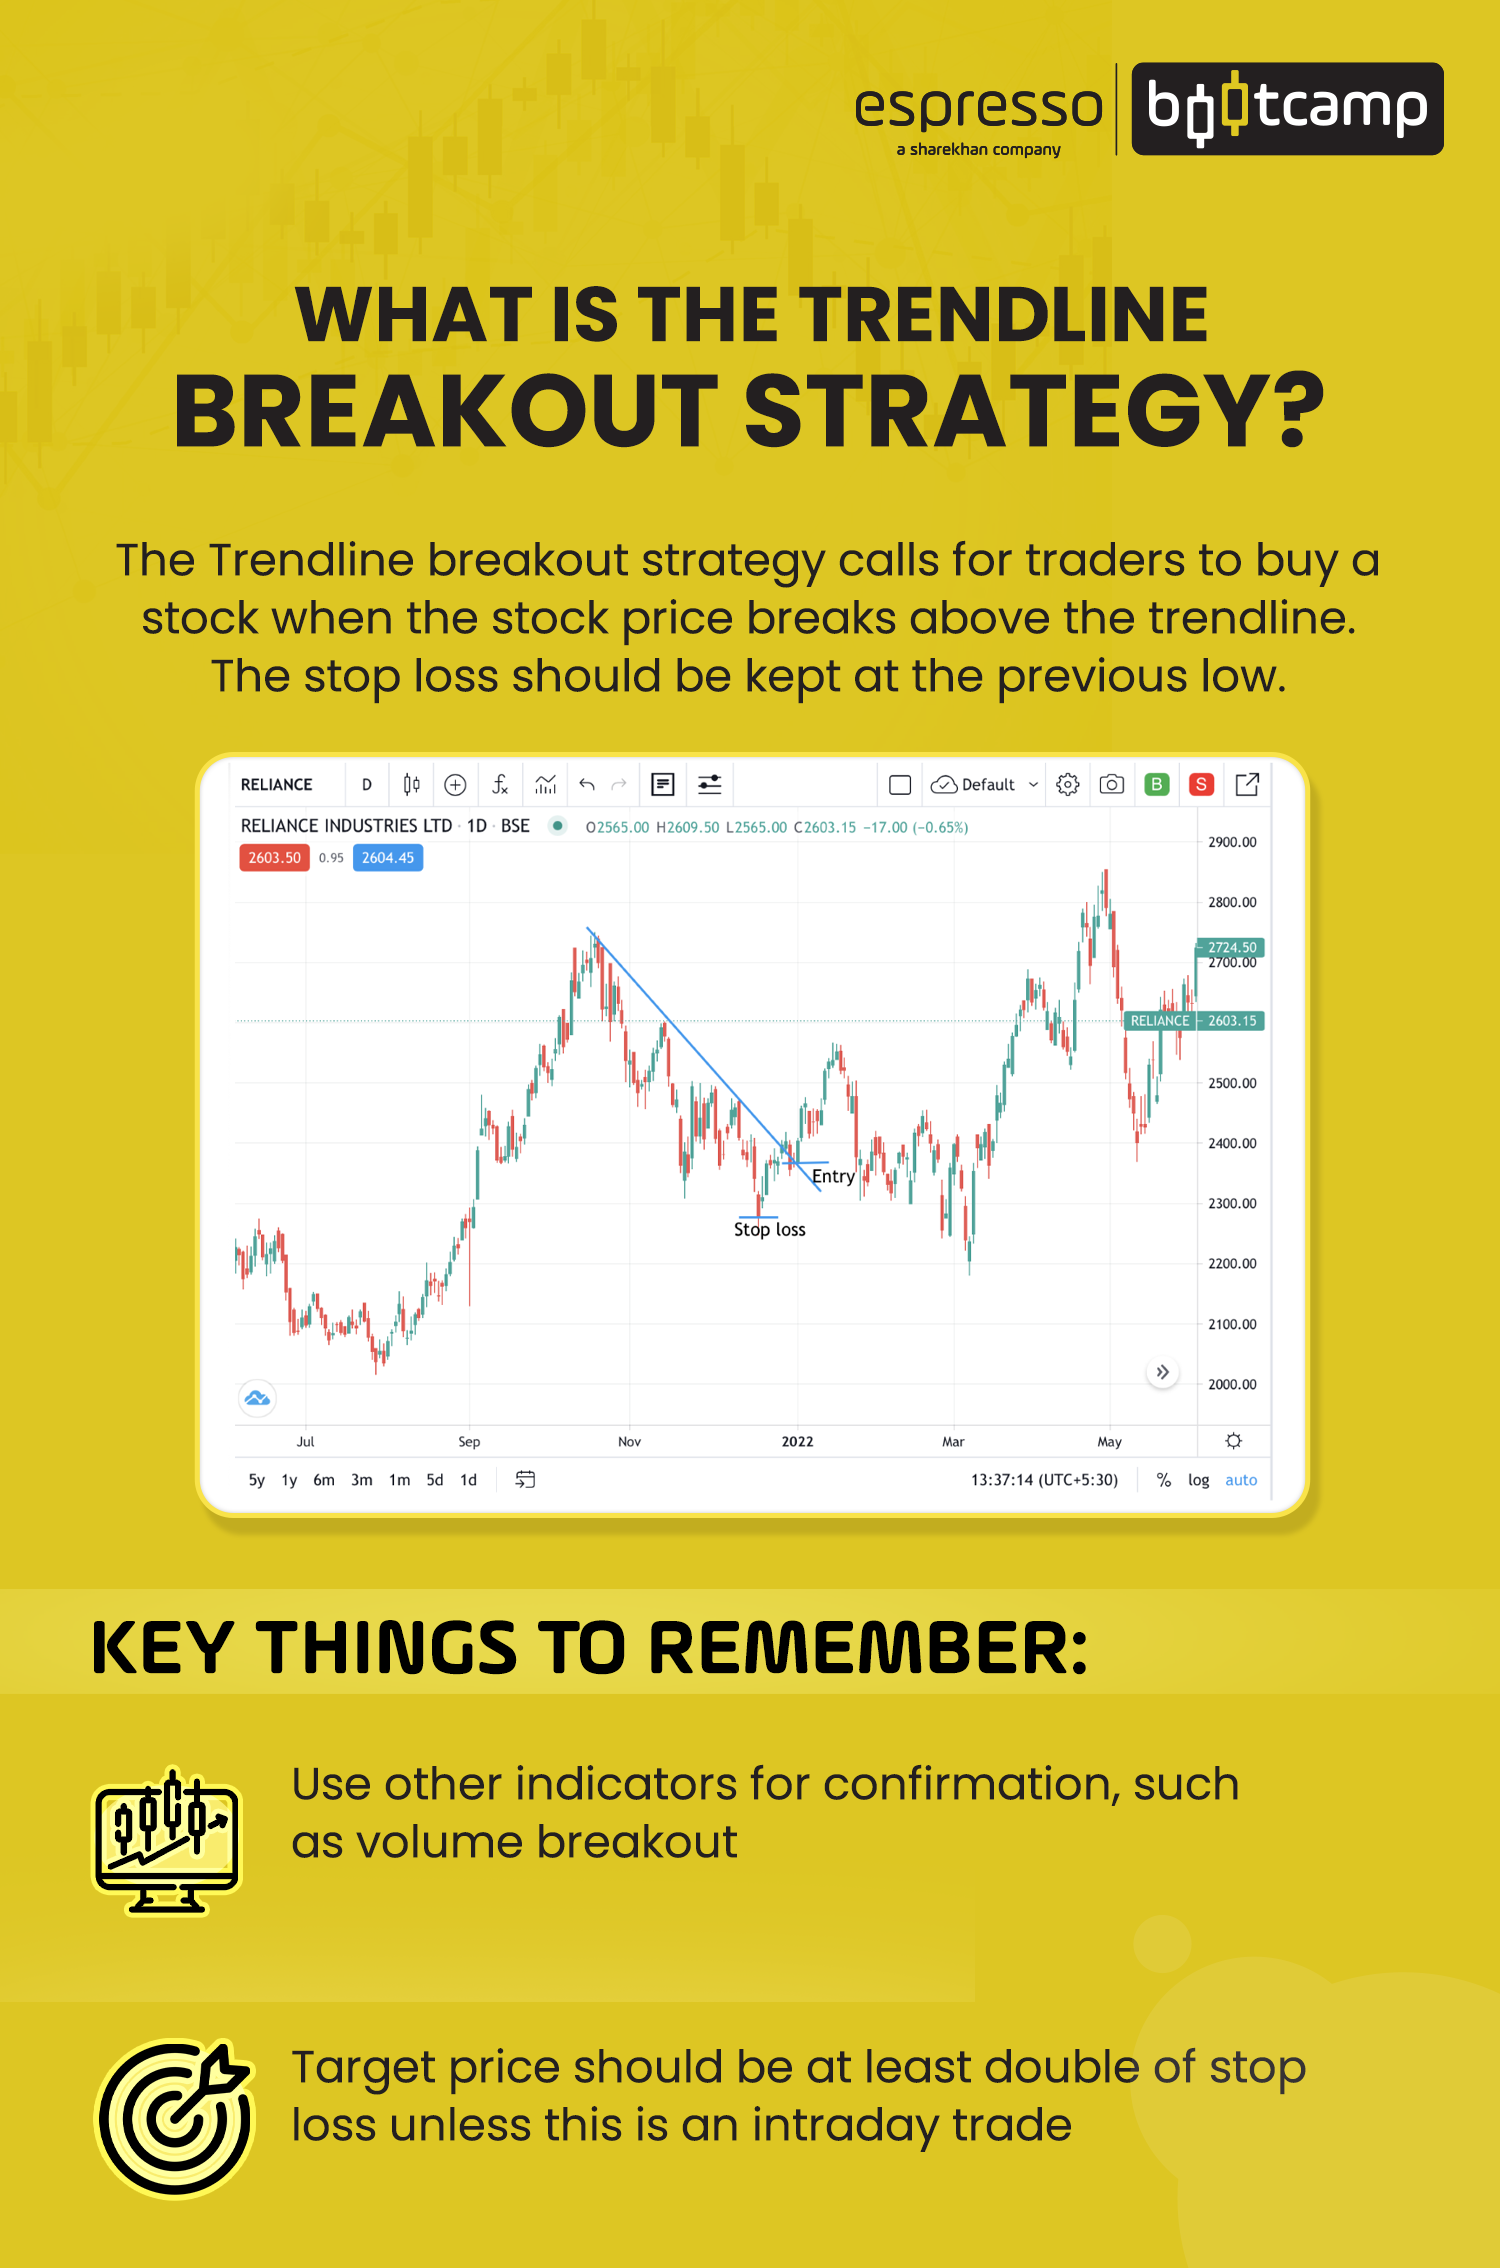
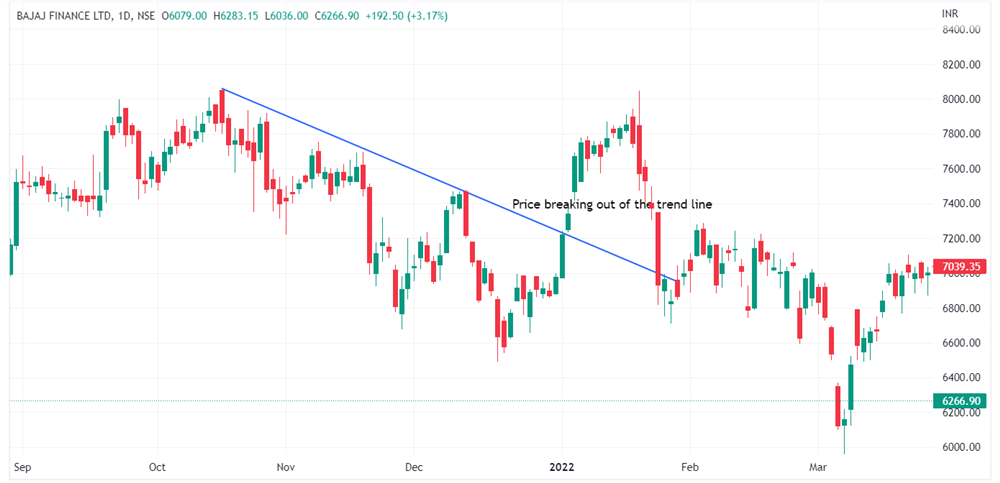
Trading the trendlines are of broadly two types - breakouts and bounces. Trendline breakouts are price movements that breach a trend line. The price breach can be a breakout on the upper side, leading to a price increase or a breakout on the lower side, leading to a price decrease.
However, one has to understand that a breakout is always on the opposite side of the trend. If a stock is in an uptrend, a breakout should happen below the trendline. If a stock is in a downtrend, the breakout should happen above the trendline. But a short-term trend breakout within the main trend can happen when there is a pullback.
For example, in an uptrend, the trendlines are plotted by joining swing lows. As and when the price goes against the uptrend, another trendline joining the swing highs is drawn. This trendline, which is inside the original trendline, can be a breakout line in the direction of the original uptrend. This holds true for a downtrend breakout as well. In a downtrend, the trendline is plotted by joining swing highs. As and when the price goes against this trend, another trendline joining successive swings lows are drawn. This inner trendline can be a breakout line in the original direction of the trend.
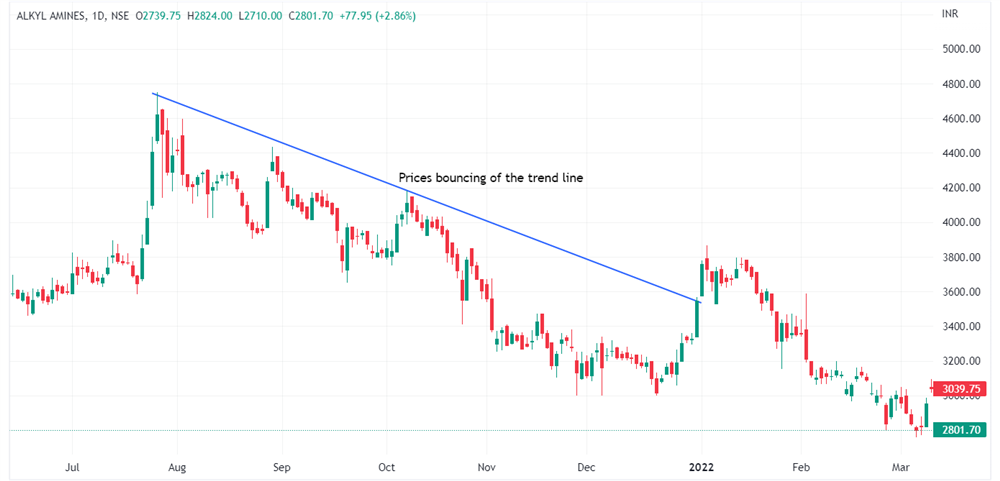
Trendline bounces happen when prices spring back in the direction of the original trend after touching the trendline. A bounce for an uptrend happens when the prices retrace to find support at the trendline and bounces off in the direction of the uptrend. A bounce for a downtrend happens when the prices retrace to find resistance at the trendline and bounces off in the direction of the downtrend. A break and a retest of a trendline can be a potential trading opportunity.
Combining trendlines and indicators
Trendlines are the most useful technical analysis tools available. However, it is always helpful to have a combination of tools, indicators or price action for confirmation of a trend. This allows a trader to breathe easy. Trendlines can be combined with candlestick patterns, moving averages, Fibonacci retracements or extensions.
A bounce at the trendline can be confirmed with a candlestick pattern like that of a pin bar. It can also be confirmed if the candlestick pattern is of a bullish or bearish engulfing candle. Fibonacci retracement can also be used to confirm a bounce back when the retracement levels coincide with the trendline. Similarly, moving averages, which coincide with the trendline, can also be used to trade a bounce back or a breakout.
Points to remember
- Trendlines, no doubt, are one of the most useful tools for identifying trading opportunities. However, there is no one perfect method of drawing trendlines.
- While many use the highs and lows to connect a trendline, many others use the closing price.
- It is also necessary to understand that there may be overlaps in a trendline but it is important that it has enough touch points.
- The urge to force fit a trendline can go against the trade.
- The most important caveat is “trade with a stop loss.
 0
|
0
|
 0
0

