
 Watch
Watch Humans have, since time immemorial, always been impressed with predictive power. Knowing the future has attracted kings, emperors, heads of countries, the common man, and even traders.
Knowing the future can be very profitable for a trader; imagine the riches that can be reaped if one knows where the prices are headed beforehand.
Leading indicators have been constructed to inform the trader of the likely move in the market. Some of these use mathematical functions to arrive at a probability-based model to predict future directions, while others use technical analysis or time cycles or a combination of technical analysis and cycles to predict the next market top or bottom.
One such popular method that has been used is the Elliott Wave Theory.
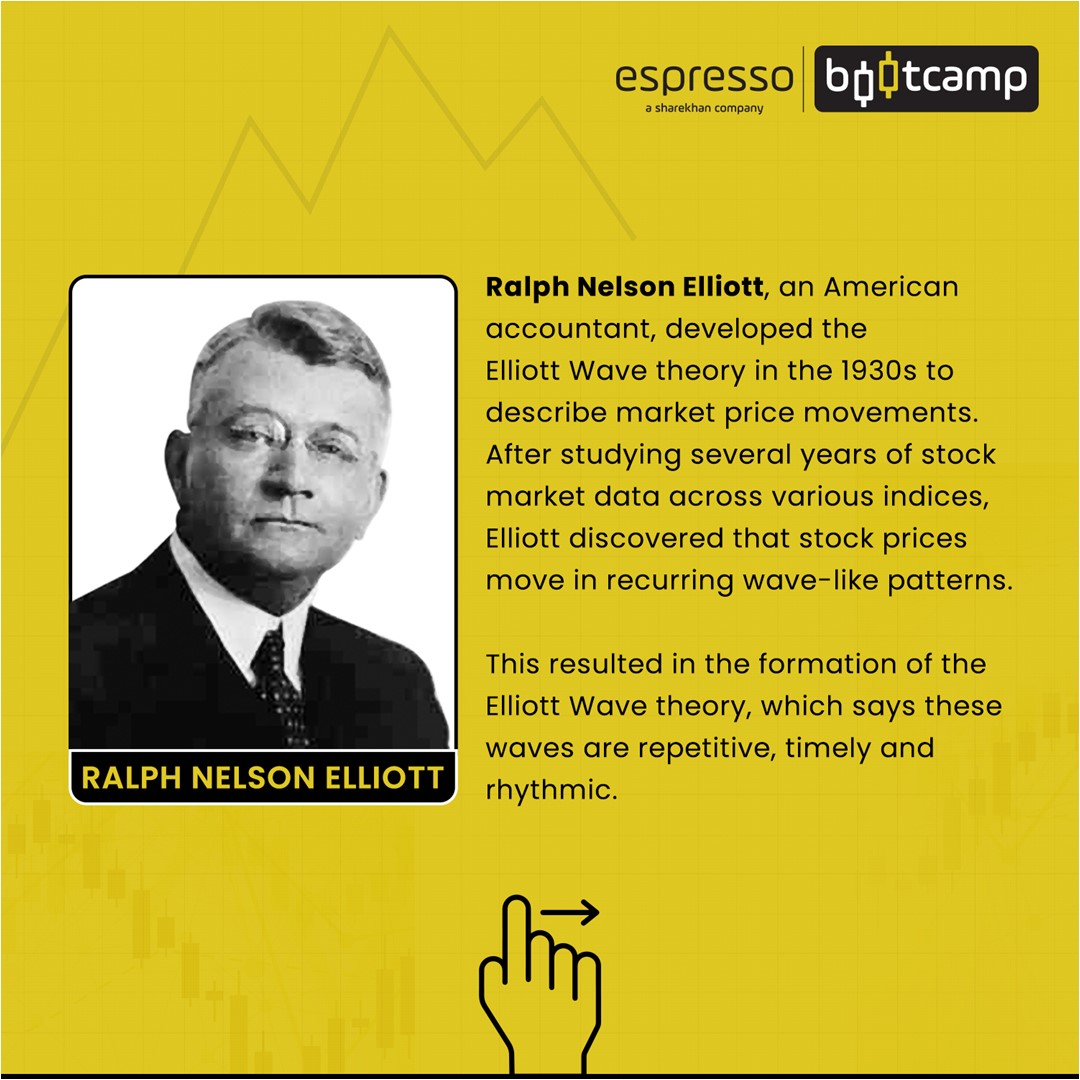
This theory was developed by the American accountant Ralph Nelson Elliott in the 1930s after studying several years of stock market data across various indices. Elliott was able to predict the market bottom in 1935 and since then has found wide followership across the globe.
Technical analysts following the theory call themselves Elliottticians. They are increasingly being used by analysts to predict market turning points which offer a low-risk trading opportunity.
The hypothesis of Elliott Wave Theory
Elliott noticed the swings in mass psychology repeated in a predictable manner among market participants. He correlated these mood swings in the financial markets to the recurring fractal patterns called waves. Fractals are mathematical structures or statistical structures which repeat themselves on smaller scales. They are also common in nature, as in the case of a snowflake, where the same design of the larger snowflake is repeated on smaller flakes within it. Elliott observed that the same wave pattern was formed on a larger time scale and kept forming on lower timescales. The greatness of Elliott is that the wave formation he observed in the markets was much ahead of its time. Scientists, mathematicians, and biologists could only prove it half a century later.
In his later days, Elliott found out that the waves moved in a particular manner, as described in the Fibonacci series.
Understanding Elliott Wave indicator
The Elliott Wave patterns are a bit complex, and hence it has few dedicated followers. There are 15 different degrees of waves that a trader needs to know in order to count them properly and trade successfully.
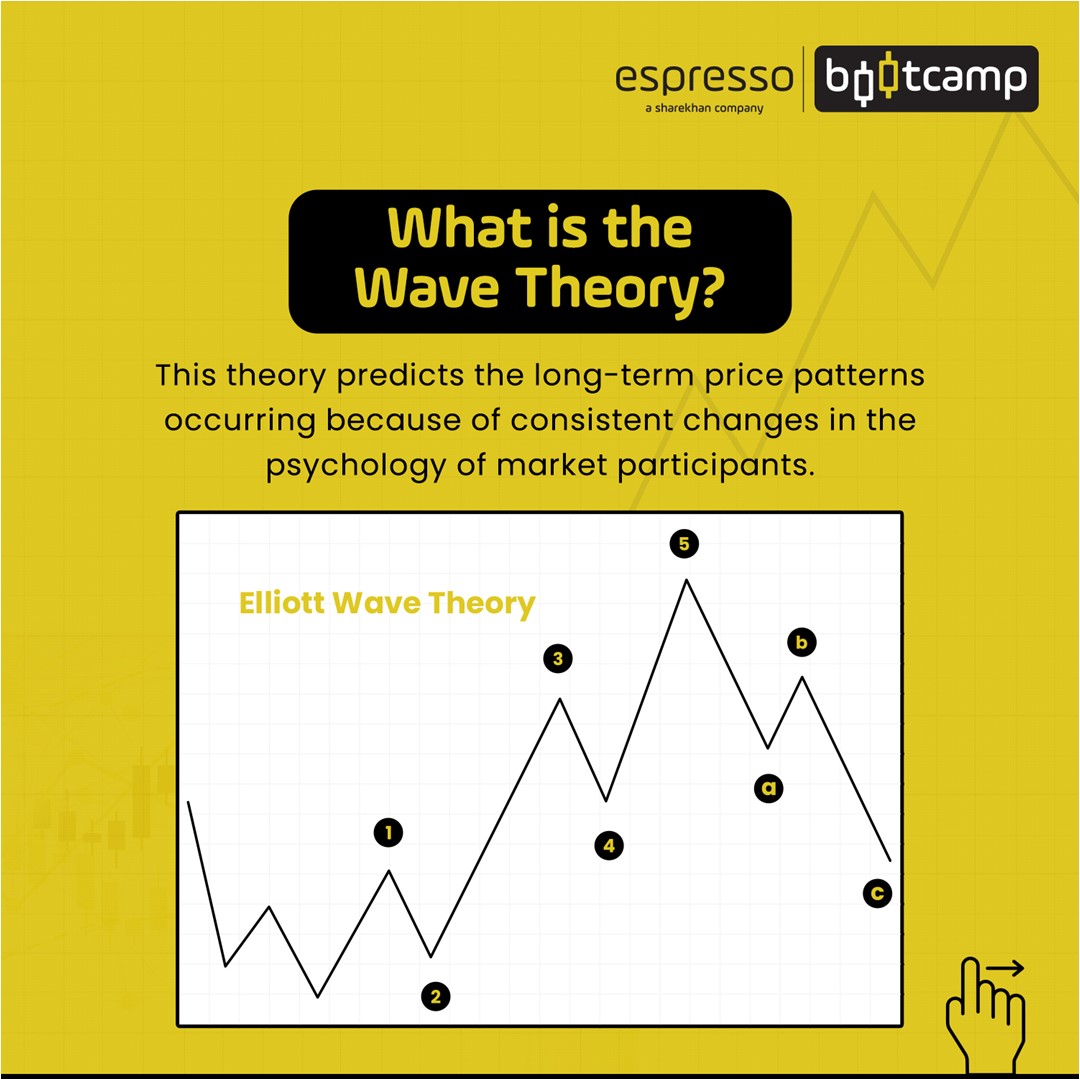
The underlying principle of the theory is that stock price movements can be reasonably predicted by studying price history as the markets move in wave-like patterns driven by investor sentiment. The market moves in a similar pattern as is widely seen in nature, like the ocean waves, the movements are repetitive, rhythmic, and timely.
Having said that, Elliott Wave Theory is not an absolute science. At most, it offers high-probability opportunities based on similar patterns observed earlier in nature.
The Basics
Elliott based his principles on human psychology and observed that the trader or an investor’s psychology passed through phases of optimism and pessimism and vice versa in a repeated manner. It is this collective psychology that causes market prices to move up and down.
This behaviour of humans is seen at all time scales, and a large wave is a collection or sum total of smaller similar waves. The inference one can draw is that the market moves in waves or cycles, and if one is able to know in which wave he is in, the trader would be able to predict future movements.
Waves
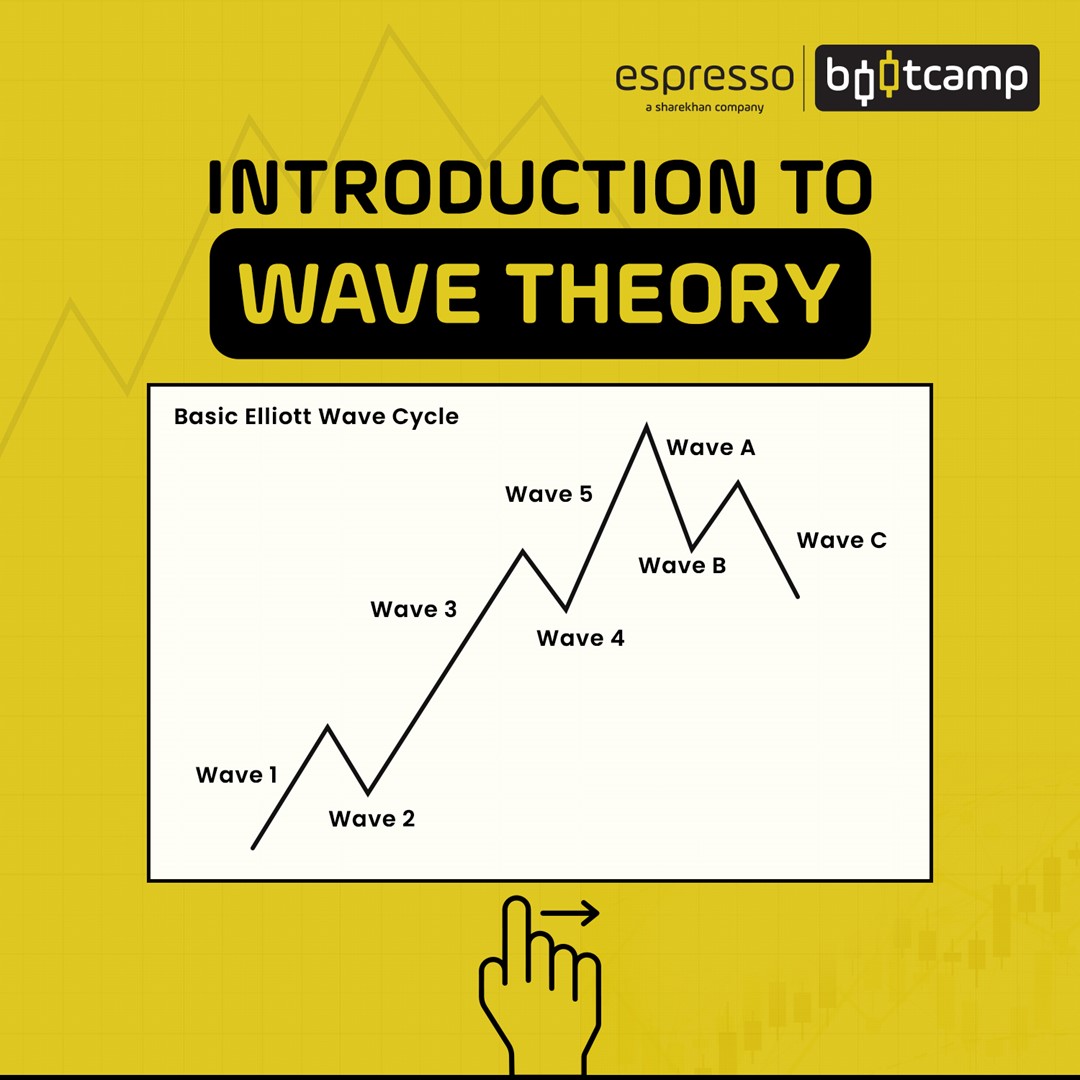
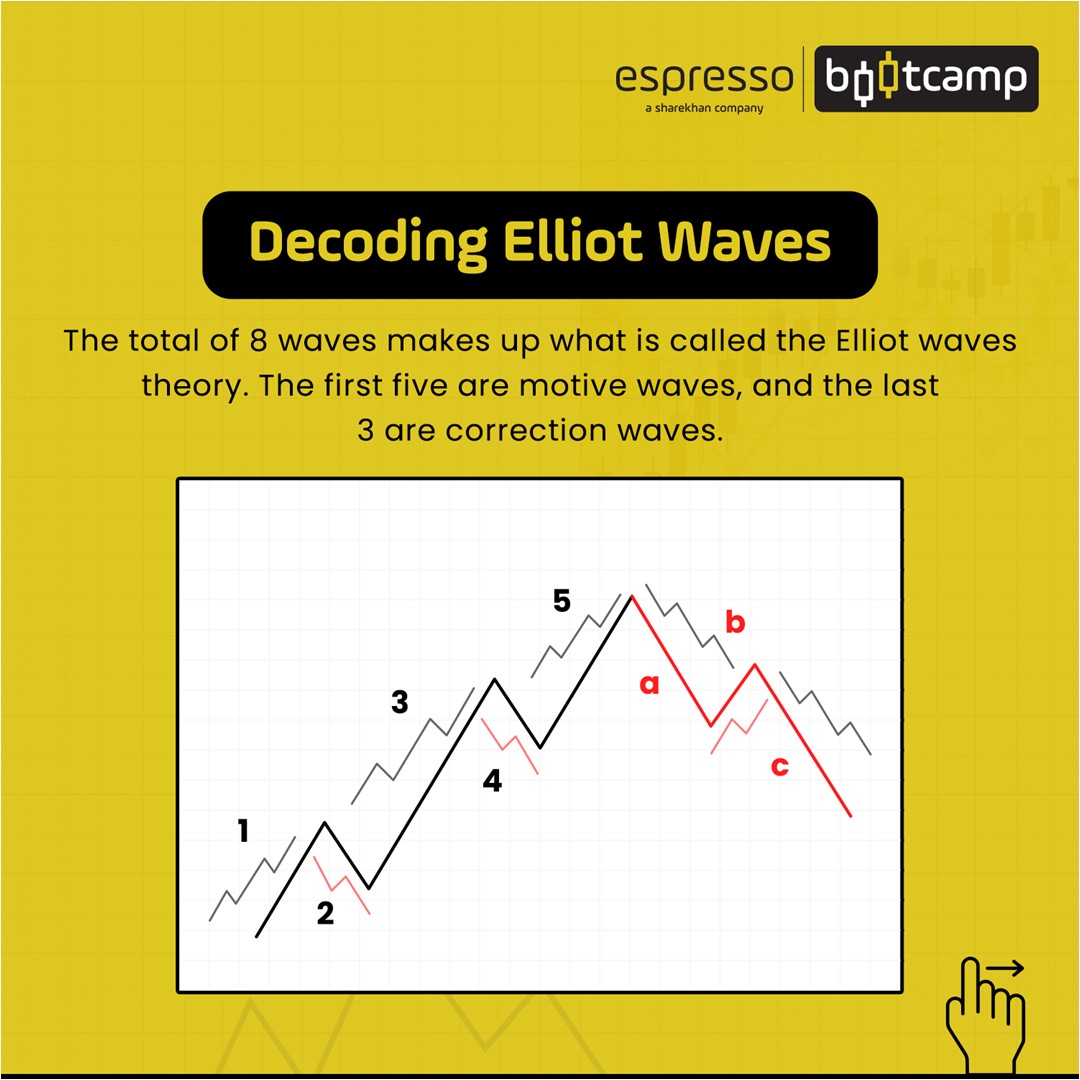
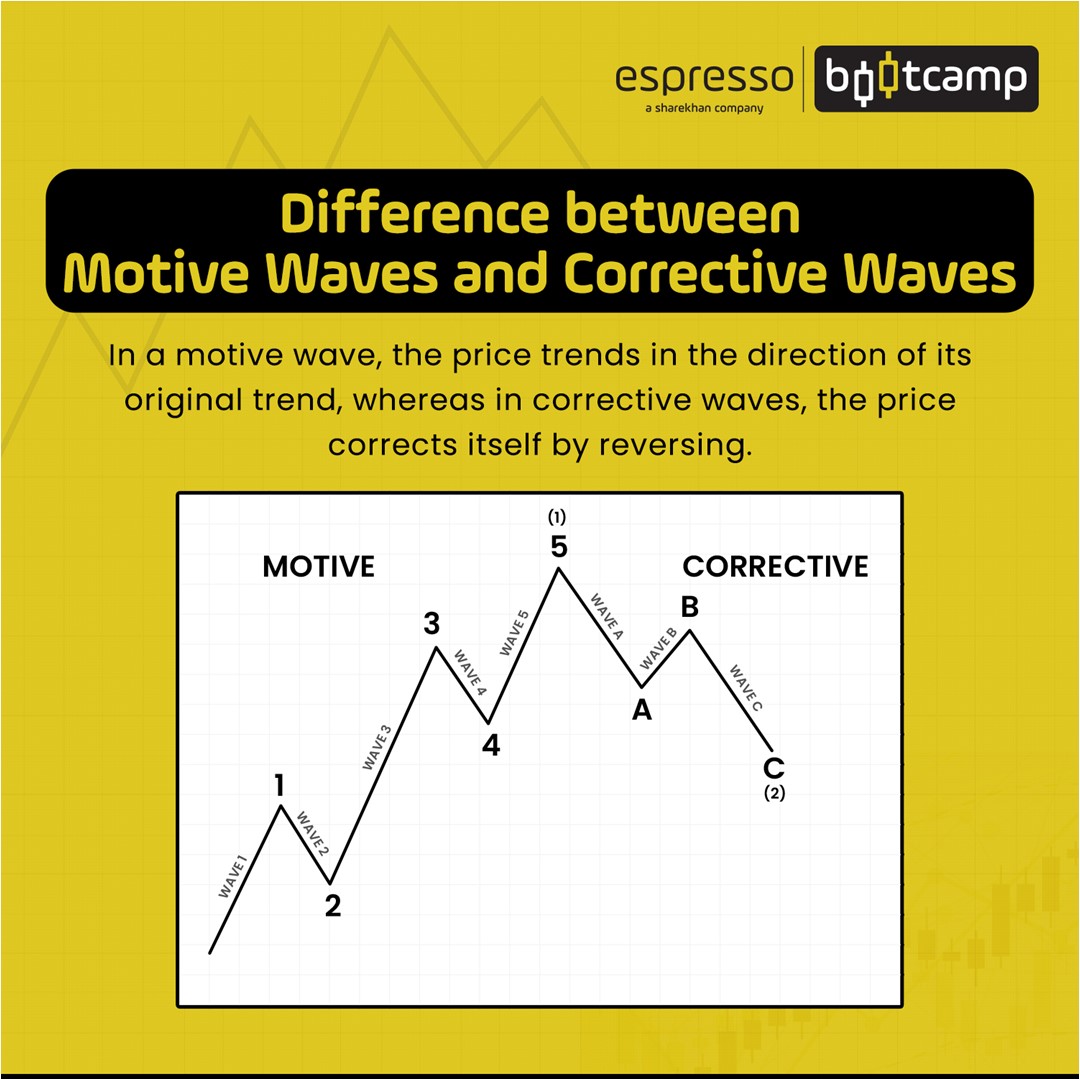
According to Elliott Wave Theory, market movements can be summed up into two kinds of waves -- motive or impulse waves and corrective waves.
Impulse or motive waves are movements that occur in the direction of a trend, while corrective waves occur in a direction opposite to the ongoing trend.
Impulsive (Motive) waves
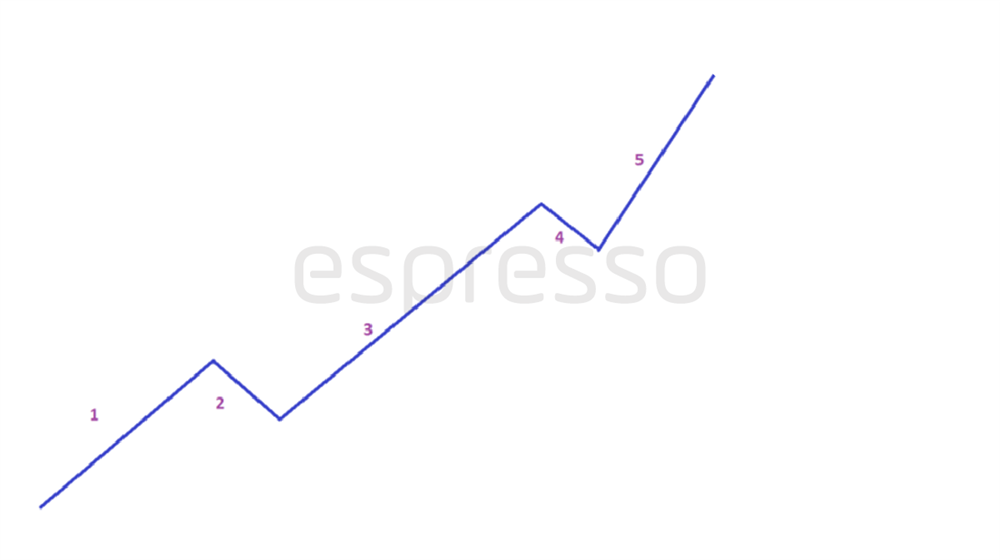
In a bull market, an impulse wave moves in the direction of the market's main trend. It is made up of five wave patterns, three moving in line with the uptrend and the other two in opposite directions.
Corrective waves
On the other hand, a corrective wave moved in the opposite direction of the main trend. Corrective waves have three smaller degree waves, unlike five in impulse waves.
In order to better understand the Elliott wave principles, let's walk through an entire market cycle – rising and falling with the waves.
We shall consider a bull market scenario.
Wave 1: This wave starts with smart investors and traders finding the market to be underpriced and start slowly nibbling in the market and building up their positions. This is where the ‘smart’ money is getting involved in the market while the retail investor and the media are discussing a doomsday scenario and staying away from the markets.
Wave 2: At the start of Wave 2, some swing traders and short-term investors start booking their profits, bringing the market down. Their selling, however, is not as vigorous as the price does not go to the lows of Wave 1.
Wave 3: More smart traders and investors notice the movement in the price and want to join the party. Prices move up slowly but surely. According to Elliott and his followers, this is the strongest and the longest wave in the bull run, where many people in the market join the rally and want to be a part of the move.
Wave 4: Profit booking comes in as traders feel the market is overheating. But as more traders, especially the retail ones, do not want to be left out, Wave 4 is generally shallow. Wave 5: This is the euphoric stage of the market where all and sundry want a piece of it. The smart money, at this point, is exiting the market or even shorting it while the retail investors jump in. This is the final stage of the bull run and, in terms of duration, maybe the shortest, where the price moves higher in a very short period of time.
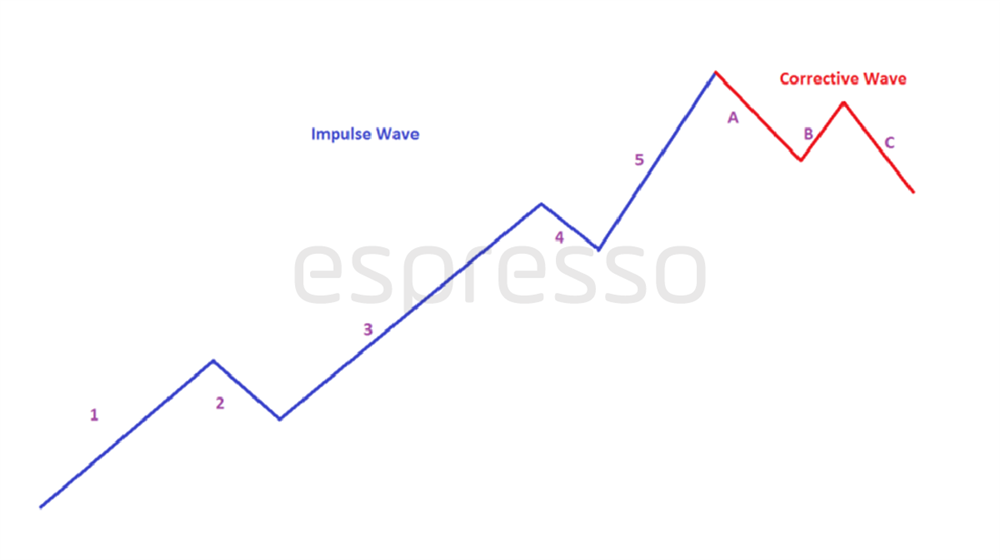
The entire sequence of the Impulse Wave described above can be seen in the chart below
We shall now see what a corrective wave looks like on an impulse wave on the chart.
Within each of these waves, there are many wave patterns that are formed in a similar fashion.
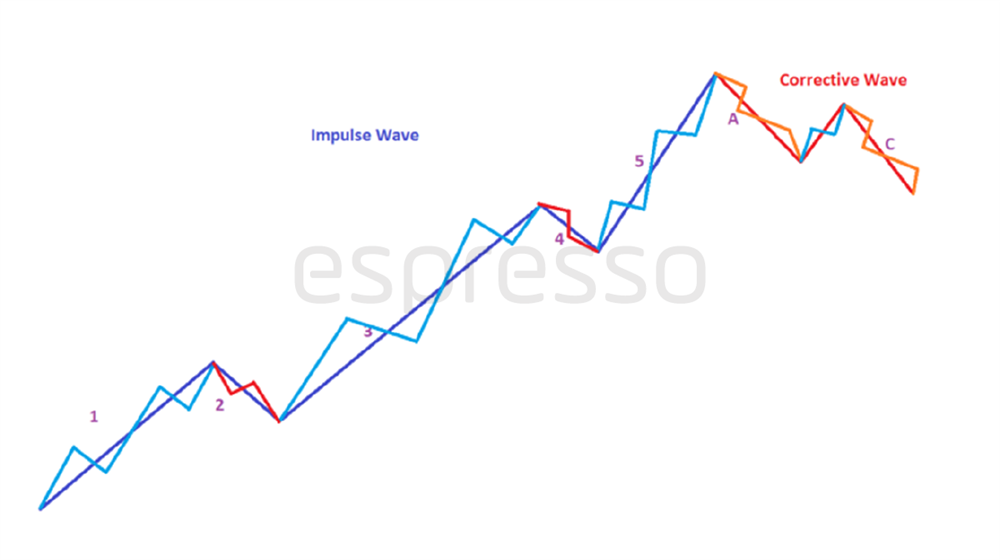
The chart below attempts to depict how the wave patterns are formed within a large one and continue itself ad infinitum. The 5 + 3 wave pattern defines a complete cycle.
Rules of Elliott Waves
There are certain rules that every Elliottician worth his salt follows. These are mainly with respect to the price movement and help him in his wave count.
Rule 1: Wave 2 cannot retrace more than 100 percent of Wave 1. In other words, Wave 2 cannot fall below Wave 1.
Rule 2: Wave 3 cannot be the shortest among the three impulse waves 1, 3, and 5. Wave 3 is when most of the traders and investors observe the rally and join in.
Rule 3: Wave 4 can never overlap with Wave 1. The correction after wave 3 should be shallow and not touch the highs made in wave 1.
Does Elliott Wave Theory work?
One biggest fallbacks of Elliott Wave Theory is its subjectivity, most traders differ in their reading of the waves. Counting waves is a tedious and meticulous process, most retail traders feel like it is too much work.
Conclusion:
Like most technical analysis tools, Elliott Waves are also subjective and are not a perfect science. But a trader can gain by trading the waves with proper risk and money management techniques.
 0
|
0
|
 0
0

