
 Watch
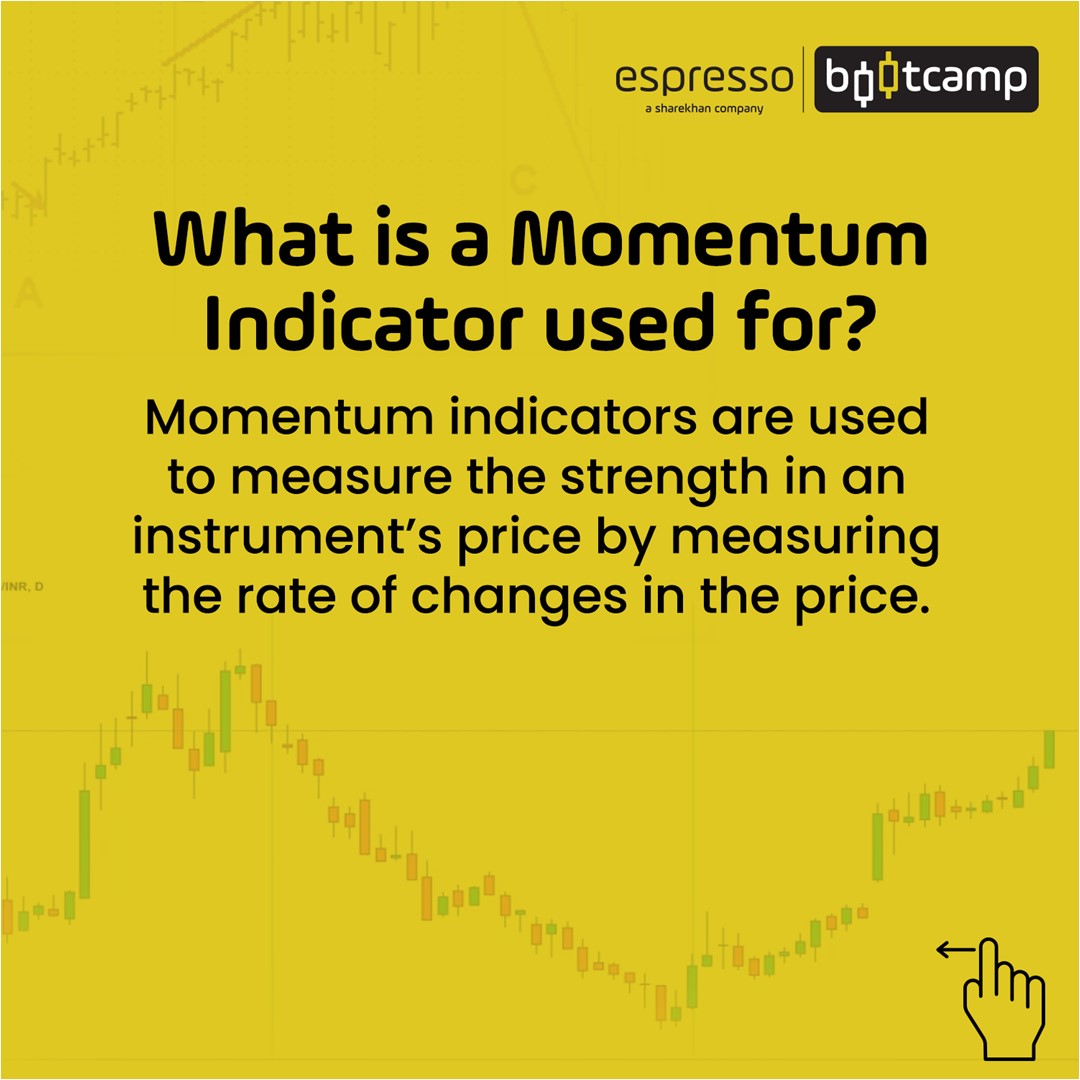
Watch As we had briefly discussed in the previous chapter, momentum indicators are indicators used to identify the trend and momentum of the prices of a security. Momentum indicators by definition use price averages as their input to construct a line that oscillates between overbought and oversold areas.
Let us examine some popular types of momentum indicators in technical analysis:
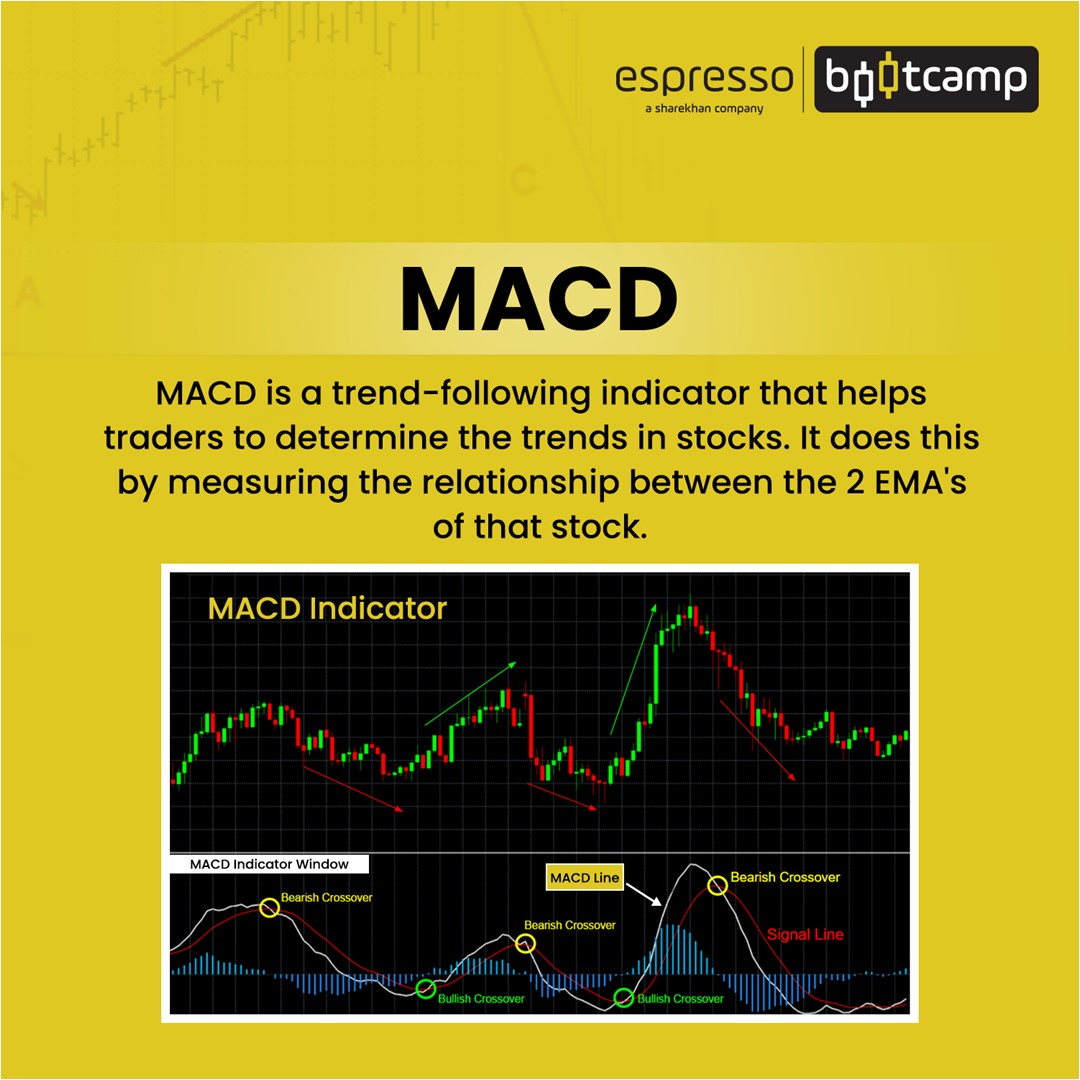
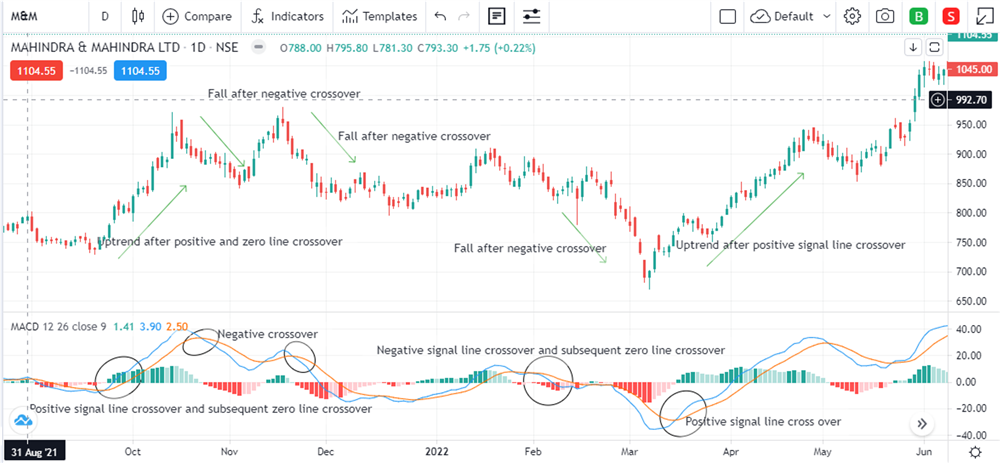
Moving average convergence divergence (MACD) is one of the most popular trends and momentum indicators. It uses two exponential moving averages (EMAs) to chart a MACD line. A 12-period EMA is subtracted from a 26-period EMA to construct a MACD line. A 9-period EMA is used as a signal line. The MACD oscillates between the zero lines. While the averages are trend following, the MACD line indicates momentum. Therefore, MACD incorporates both trend and momentum.
MACD histogram is the difference between MACD and a signal line. If the MACD is above the signal line, the histogram is positive, and when the MACD is below the signal line, the histogram is negative.
Traders employ two methods to initiate trades - signal line crossover and zero-line crossover. A signal line crossover happens when the MACD crosses above for a long trade and crosses below for a short trade. The zero-line crossover happens when the MACD crosses above the zero line for a long trade and crosses below the zero line for a short trade.
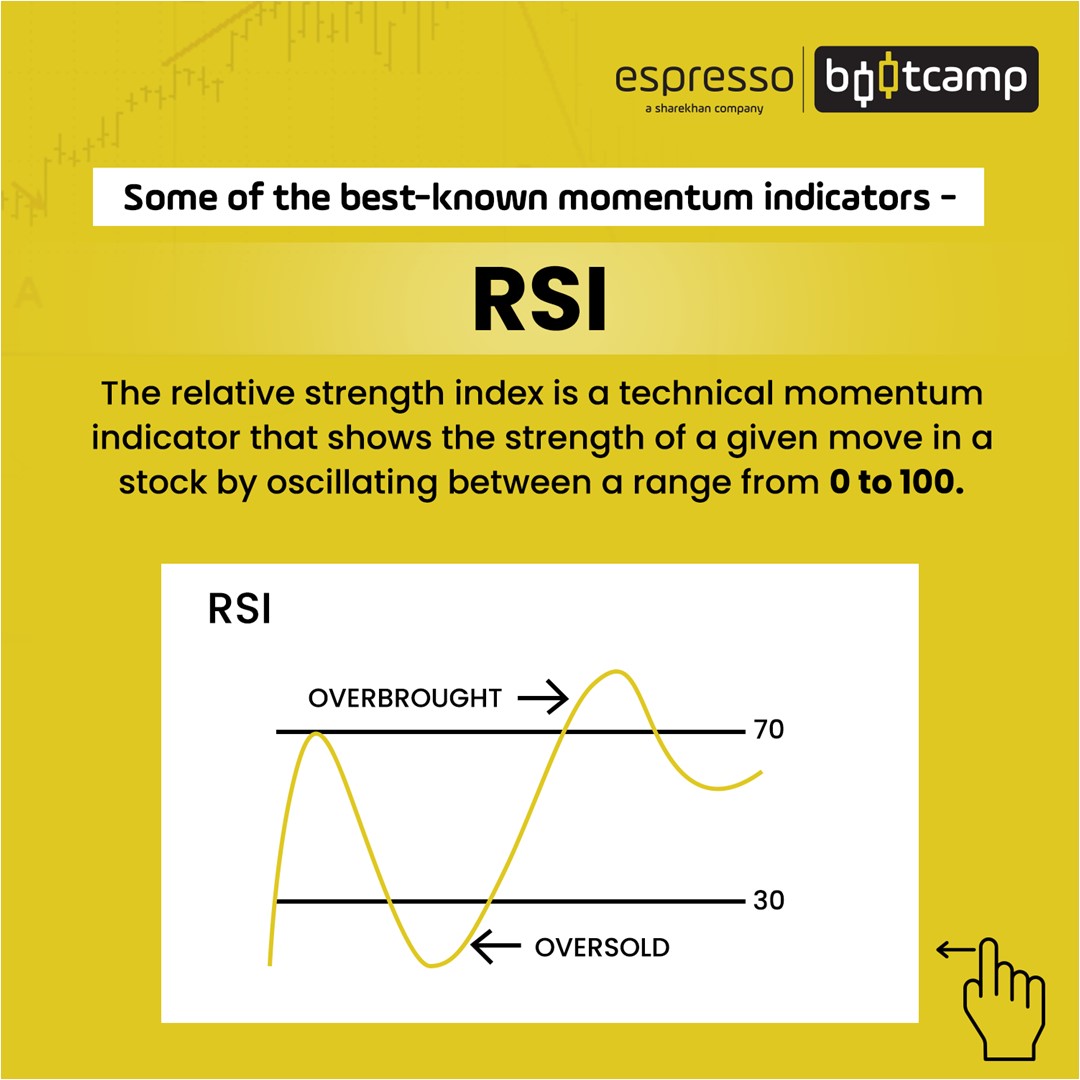
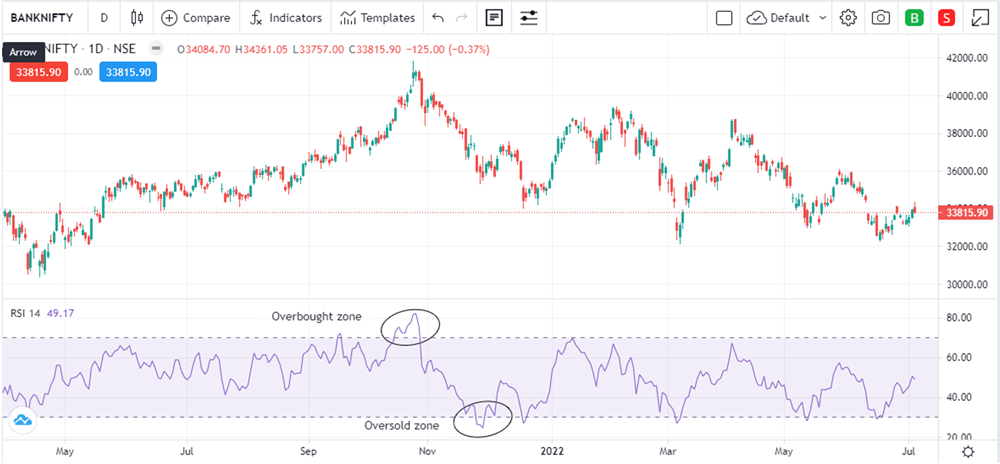
Relative strength index (RSI) is a popular oscillator or momentum indicator that traders use worldwide. RSI measures the speed with which the price changes. It uses the ratio of average gain and average loss for the last 14 periods. RSI oscillates between 0 and 100.
An RSI reading above 70 implies overbought, and a possible reversal is on the cards. An RSI below 30 is considered to be oversold; again, a possible reversal can happen.
Some traders use RSI readings of 80 and 20 as overbought and oversold. A centre line of 50 is used to decide the trend. If the RSI is above 50, the trend is bullish, and if below 50, it is bearish.
In a longer trend, one can use RSI as a pullback indicator. If in a larger uptrend, the RSI pulls back to 50, one can initiate a buy trade. In a larger downtrend, a pullback to 50 can be used to enter a short trade.
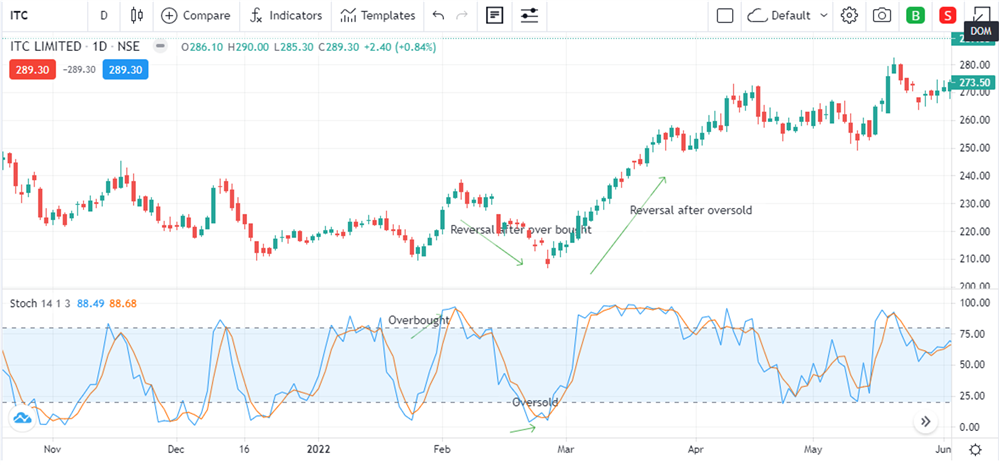
Stochastics is an oscillator or momentum indicator that consists of two lines that move in unison. The %K line measures the closing price in relation to the high or low range of the security over a period. Another line, %D, is used to smoothen the %K line by using a three-day moving average of the %K line.
Stochastics also oscillates between 0-100, with 80 being the overbought zone and 20 being the oversold zone.
Traders take a trade based on the crossover of the %K line and %D line. If the %K line cuts above the % D line, it is a buy signal. It is a sell signal if the %K line cuts below the %D line.
Average directional index (ADX) is an oscillator or momentum indicator that measures the strength and momentum of a trend. ADX uses three lines - the -DI, the +DI and the ADX.
The +DI and the -DI determine the direction of the trend. The +DI line represents an uptrend, while the -DI line represents a downtrend.
ADX is the smoothed average of the difference between +DI and -DI lines. ADX oscillates between 0-100. A rising ADX means a strong trend, and a falling ADX means a weak trend. An ADX reading above 25-50 is termed as a strong trend, while a reading above 50-75 is termed to be very strong. A reading above 75 can be unsustainable, and caution needs to be exercised.
Traders look out for the crossover of +DI and the -DI. If +DI crosses above –DI, it is a positive trend reversal, and a buy order can be placed, and if -DI crosses above +DI, it is a negative trend reversal and a sell order can be placed. Along with the crossover, if the ADX is above 25, the trend is strong.
 Tata Steel.png)
Points to remember
- Momentum indicators ideally should be used with price overlay indicators for better results as they complement each other
- It will take some practice and consistency to get used to momentum indicators
- Once you get the hang of it, momentum indicators are easy to spot
- As a trader, you must know that momentum indicators can give false signals as the market digests new information and data. Trade with caution and don't forget to keep a stop loss.
 0
|
0
|
 0
0

