
 Watch
Watch As you already know, historical price data is plotted as charts to understand how it has trended in the past. But what are indicators in technical analysis? Technical indicators are analytical tools to analyse data to project future trends and behaviour based on past data.
Projection of future trends and behaviour is done by using mathematical formulae, the result of which is plotted on the chart along with the prices. Apart from prices, volume data is also used to check the intensity of the trend or behaviour. The mathematical result so derived and plotted are known as technical indicators.

Technical indicators help determine the entry and exit points of a trade. Over time, indicators have been added, and a strong repertoire is now part of the many technical packages available. One can use them on a standalone basis or in combination to analyse and make a trading decision.
Broad types of indicators in technical analysis
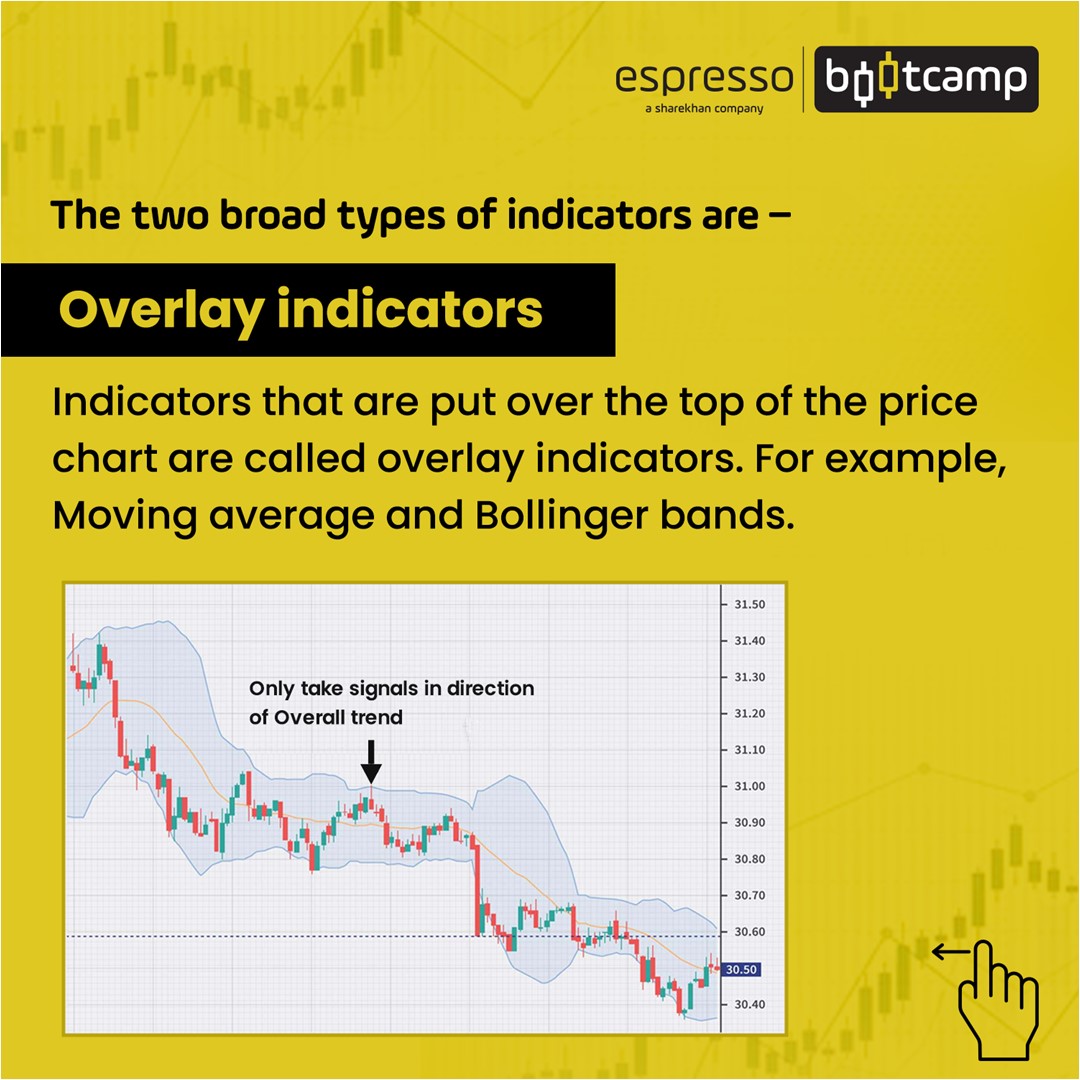
Technical indicators in the stock market are broadly classified as overlays and underlays.
Overlays indicators are overlaid or superimposed on the price data to see how these indicators behave or trend with respect to prices. They help identify areas of support resistance or demand and supply.
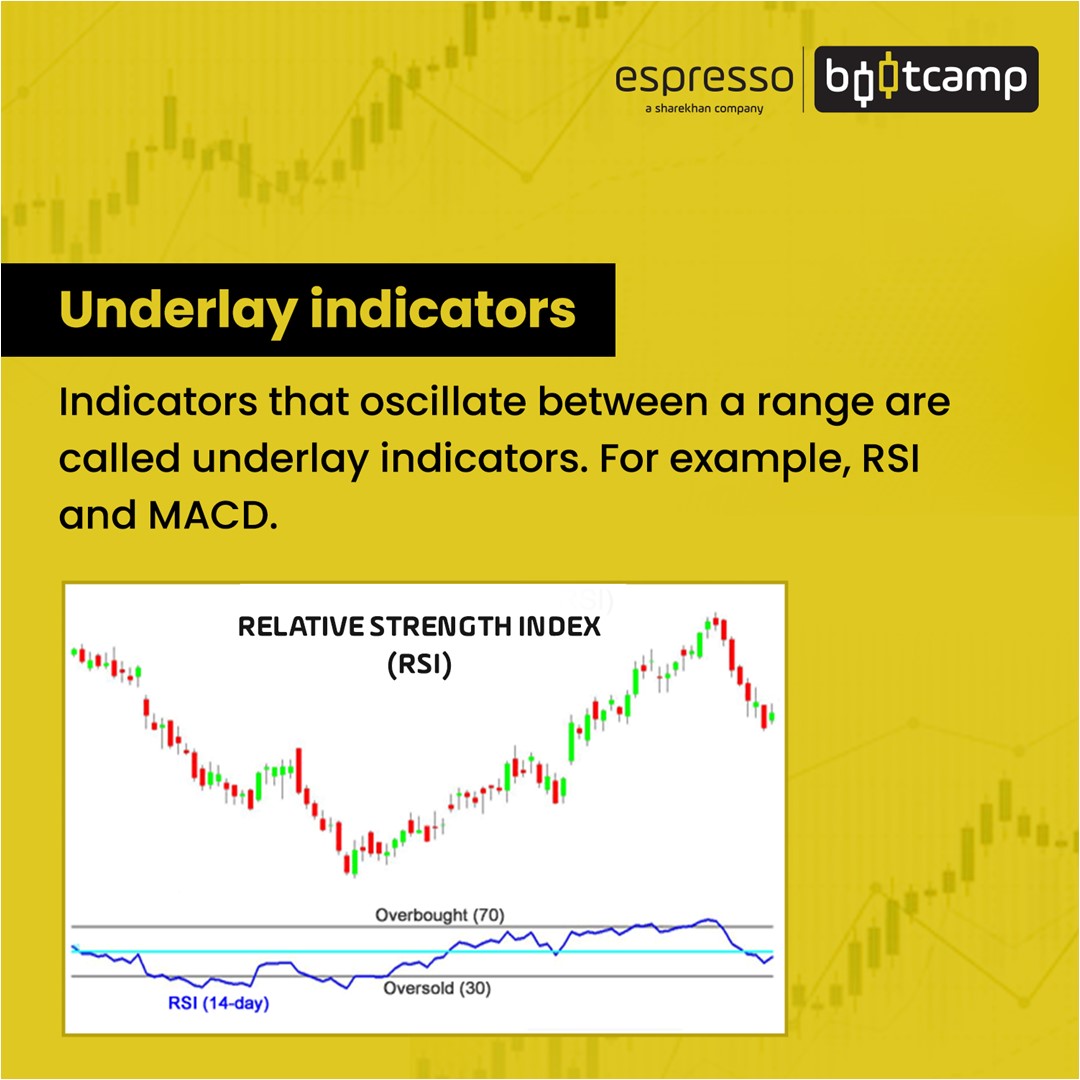
Underlays, on the other hand, are calculated and plotted separately to study their relationship with the price. These are also known as momentum indicators or oscillators.
Oscillators or underlays are indicators that oscillate between two extreme values. An upper value indicates the security is presently over-bought and likely to correct, and a lower value indicates the security is presently over-sold and likely to rise.
Apart from these, oscillators are used to identify divergence between the price and the oscillator, indicating an impending undercurrent of a bearish or bullish move. Traders use a combination of indicators and oscillators along with price action and patterns to plan their entry and exit.
Let us examine the use of indicators and get a sense of how to interpret indicators. In this chapter, we will focus on some of the popular overlay indicators, while we cover the underlay or momentum indicators in the next chapter.
Overlay indicators
Moving Averages are one of the most popular overlay indicators available for trading. They can be a simple moving average or an exponential moving average. A simple moving average is simply the moving average of the past prices of the required number of days, while an exponential moving average places more emphasis on recent prices.
Moving averages are used to identify support and resistance areas and trends. They are incapable of predicting future trends as they are lagging indicators. However, exponential moving averages are more sensitive to prices than simple moving averages.
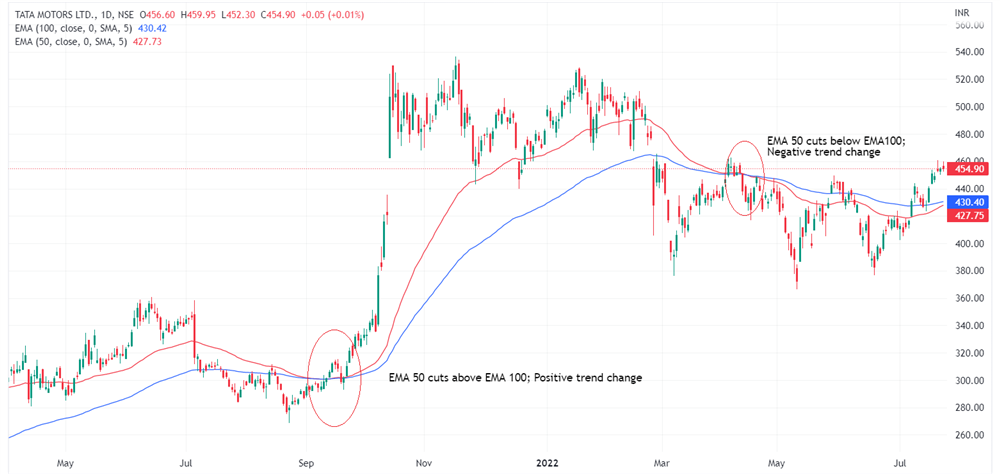
A combination of moving averages and price or moving averages with another moving average with a different period is used for trading. Generally, moving averages with shorter periods are used to generate trade signals, while moving averages with longer periods are used for support and resistance.
SMA & EMA sensitivity to prices
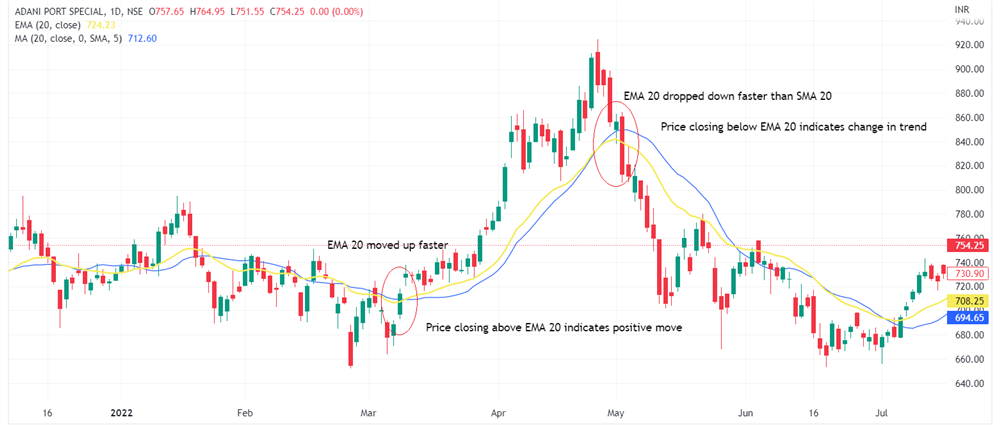
Crossover of EMA
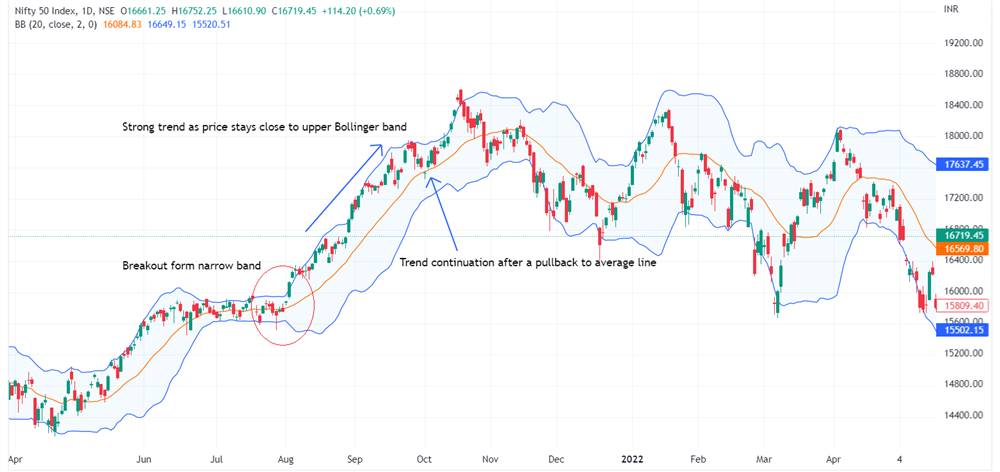
Bollinger Bands are price bands that use the standard deviation of a 20-period simple moving average. The default standard deviation is 2. Bollinger band comprises three lines - upper band, lower band and average line.
The price bands are above and below the average price. The upper band is +2 standard deviation from the average, while the lower band is -2 standard deviation from the average.
Indicators like Bollinger bands move in tandem with volatility in prices. The bands widen when prices rise or fall sharply, indicating an increase in volatility and contract when prices are flat, indicating a decrease in volatility. The prices bounce within these bands. However, it can stay close to the bands for quite some time when prices are trending. A contracting band indicates a low volatility period. A sharp price movement in either direction is highly probable when volatility sets in.
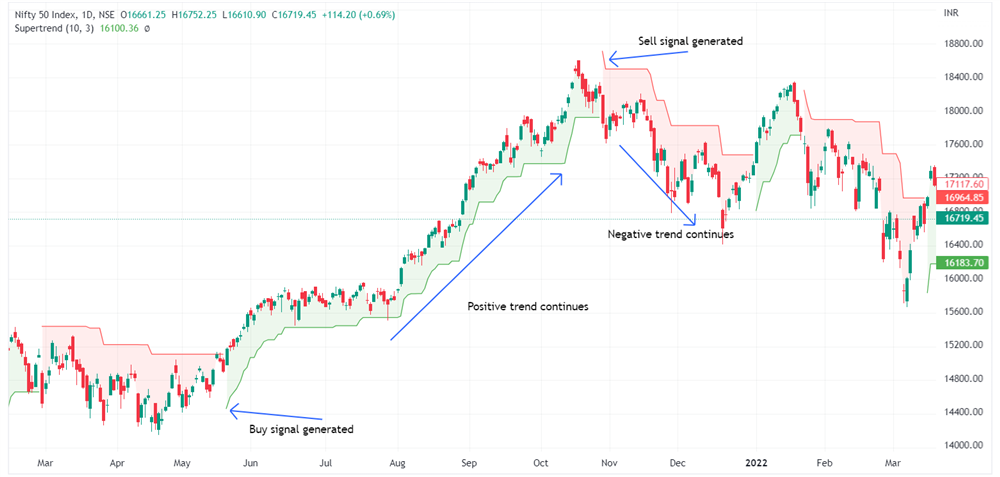
Super trend is a line indicator overlayed on the price. Apart from the buy or sell signals that super trend indicates, it also conveys price trends. It also uses colour to indicate the trend and buy or sell signals. A change from red to green indicates a change in sentiment from downtrend to uptrend and vice versa.
The super trend indicator is constructed using a combination of the average of high and low along with a volatility indicator known as an average true range (ATR) and a multiplier. The default setting is 10 ATR, and the default multiplier is 3.
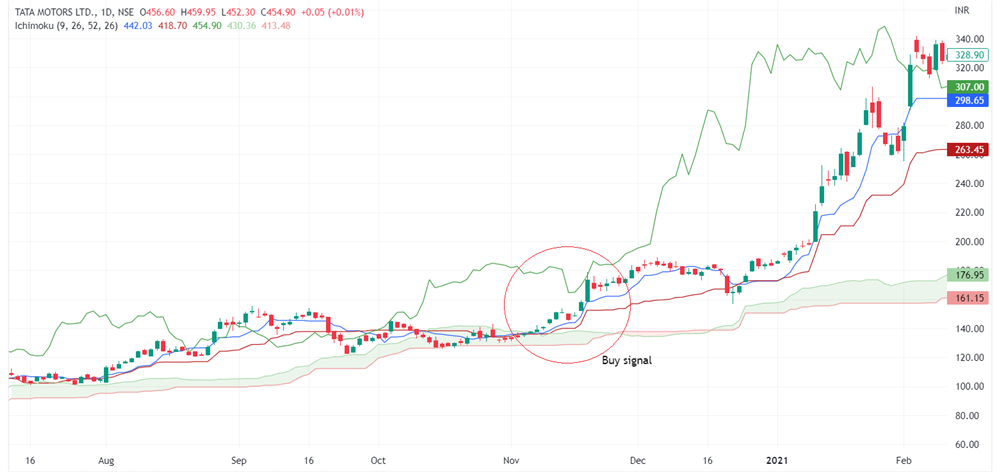
Ichimoku cloud is not only an indicator but a strategy by itself. It is designed to identify support and resistance and likely trend and give trading signals. This strategy is comprised of five average lines:
- Conversion line - Tenken-sen - is the average of a nine-period high and low. This is a faster-moving average and blue line in the chart
- Base line - Kijun-sen - is the average of a 26-period high and low. This is a slower-moving average and red line in the chart
- Leading Span A line - Senkou span A - is the average of the conversion line and the base line and green line in the chart
- Leading Span B line - Senkou span B - is the average of a 52-period high and low and dark red line in the chart. Both leading span A and B are the cloud that form in support and resistance areas
- Chikou line is the current price shifted back to the 26-period to check how the current trend is with respect to the past
For a long trade, the conversion line should cross up from below the base line. It is a strong buy signal if this crossover happens above the cloud. The prices should be above the cloud. Span A should be above Span B, and the current price should be higher than the price of the last 26 periods. It is vice versa for a short trade.
Points to remember
- Since indicators are derived from the prices, it is always lagging
- Using overlay indicators along with one more momentum indicator would improve the odds.
 0
|
0
|
 0
0

