
 Watch
Watch The artistry in technical analysis is evident when stock prices and volumes are laid on charts. Once these parameters are plotted, myriad patterns develop, conveying unique meanings to a technical analyst.
What are charts in technical analysis?
- Charts are a graphical representation of prices and volumes.
- They help identify patterns, formations and trends effortlessly.
- They are now available easily as technical analysis software is available off the shelf for a fee.
- Some websites provide charts for free.
- Brokers provide charting tools to their clients.
- Plotting is done with prices on the Y-axis and time scales on the X-axis.
- Intervals are either based on logarithmic or linear scales.
Since prices can be plotted on different time scales, it is easier to see and understand the trend and behaviour of prices during specific events. Volatility can also be measured using charts. They can be used by technical traders and fundamental analysts for appropriate entry and exit.
Different types of charts in stock market
Now that we know the definition of charts in the stock market let's look at the three types of charts popularly used by technical traders.
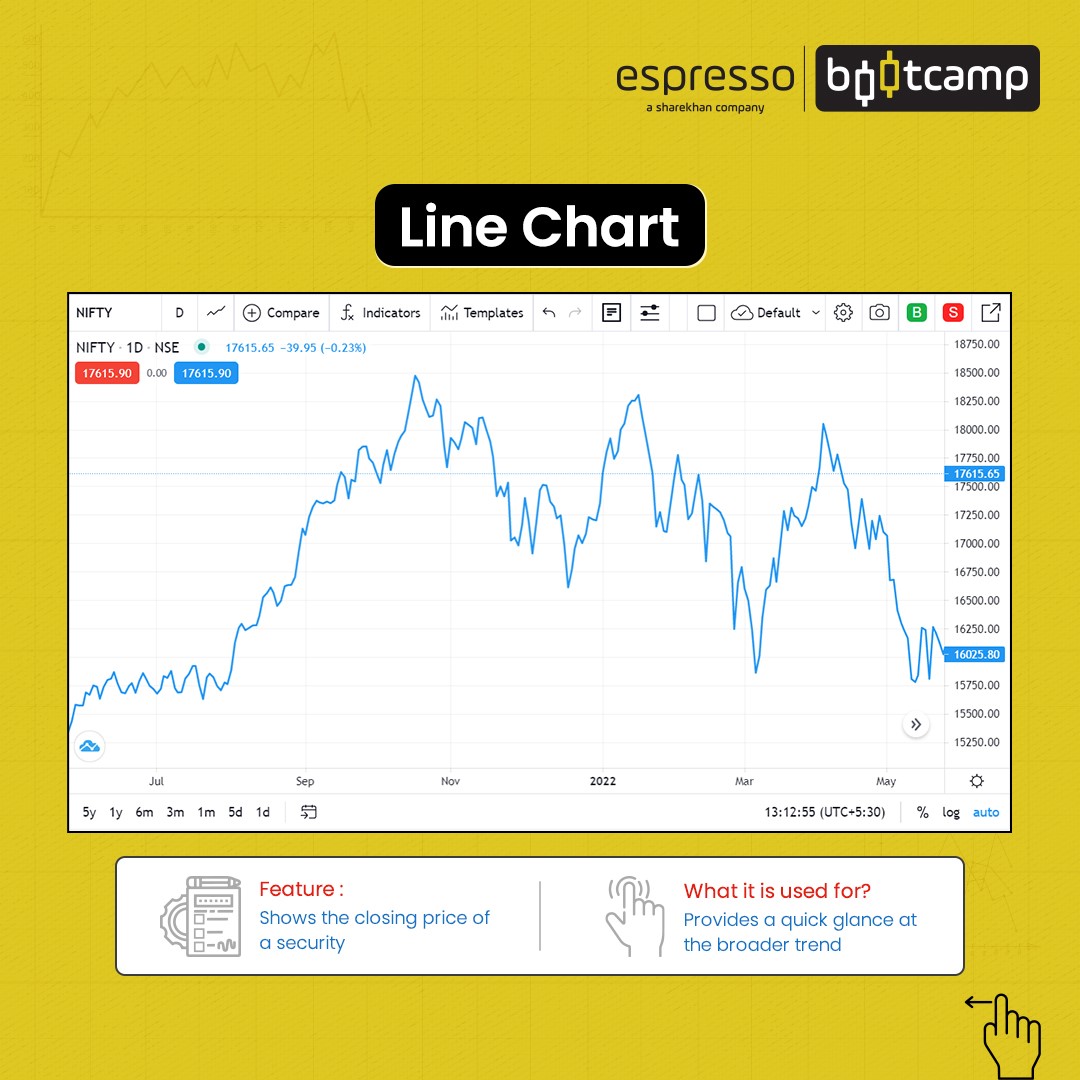
Line charts
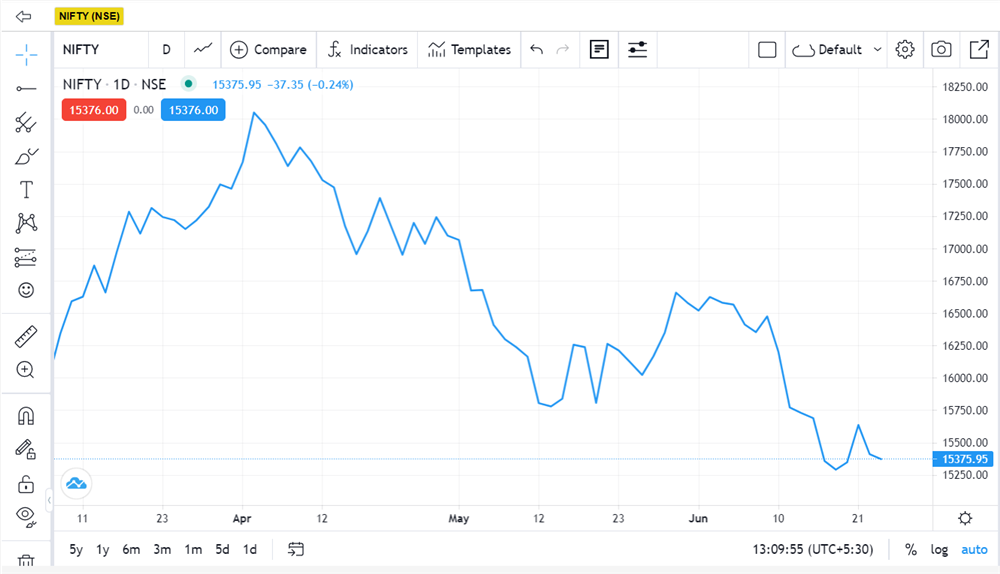
- A series of points connected by a line
- Plotted using only the closing prices
- Simple and display trends with clarity
- Trends can be determined by observing the line’s slope between a series of points
- Prices of multiple stocks or indices can be plotted at once for comparative studies
- Not used for intraday trading
- Disadvantage is they do not show the price range (high and low of the day or the accounting period) for the day
Bar charts
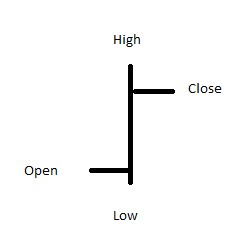
- As the name suggests, they are a vertical bar or line that carries the price information for the day or accounting period
- Also known as open, high, low and close (OHLC) charts
- Provides four sets of prices for a day or period - opening, closing, high and low
- Uses four prices, and therefore, the price range is visible in bar charts
You can observe from the above diagram that the top of the vertical line is the high of the day, while the bottom of the vertical line is the lowest price of the day. There are two small horizontal lines attached to either side of the bar or line. The horizontal line attached to the left is the opening price, while the one on the right is the closing price for the day.
There is a colour aspect to the chart too. If the closing price of a bar is more than the closing price of the previous bar, the colour is either blue or green, indicating a positive close.
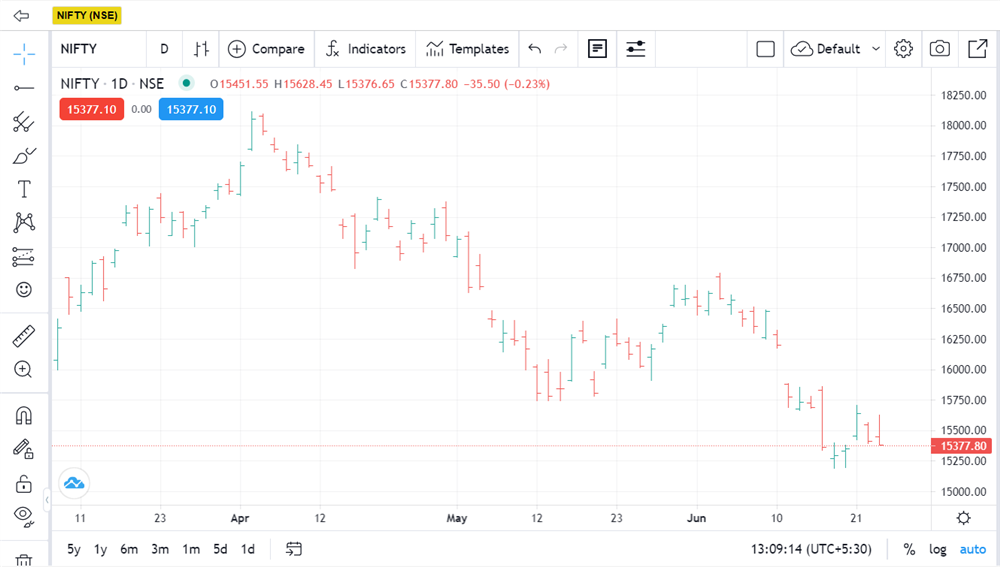
However, if the closing price of a bar is lower than the previous bar, the colour of the bar is red, indicating a negative close. Coincidentally, if the closing price of a bar is similar to the closing price of the previous bar, the colour of the previous bar is the colour of the current bar.
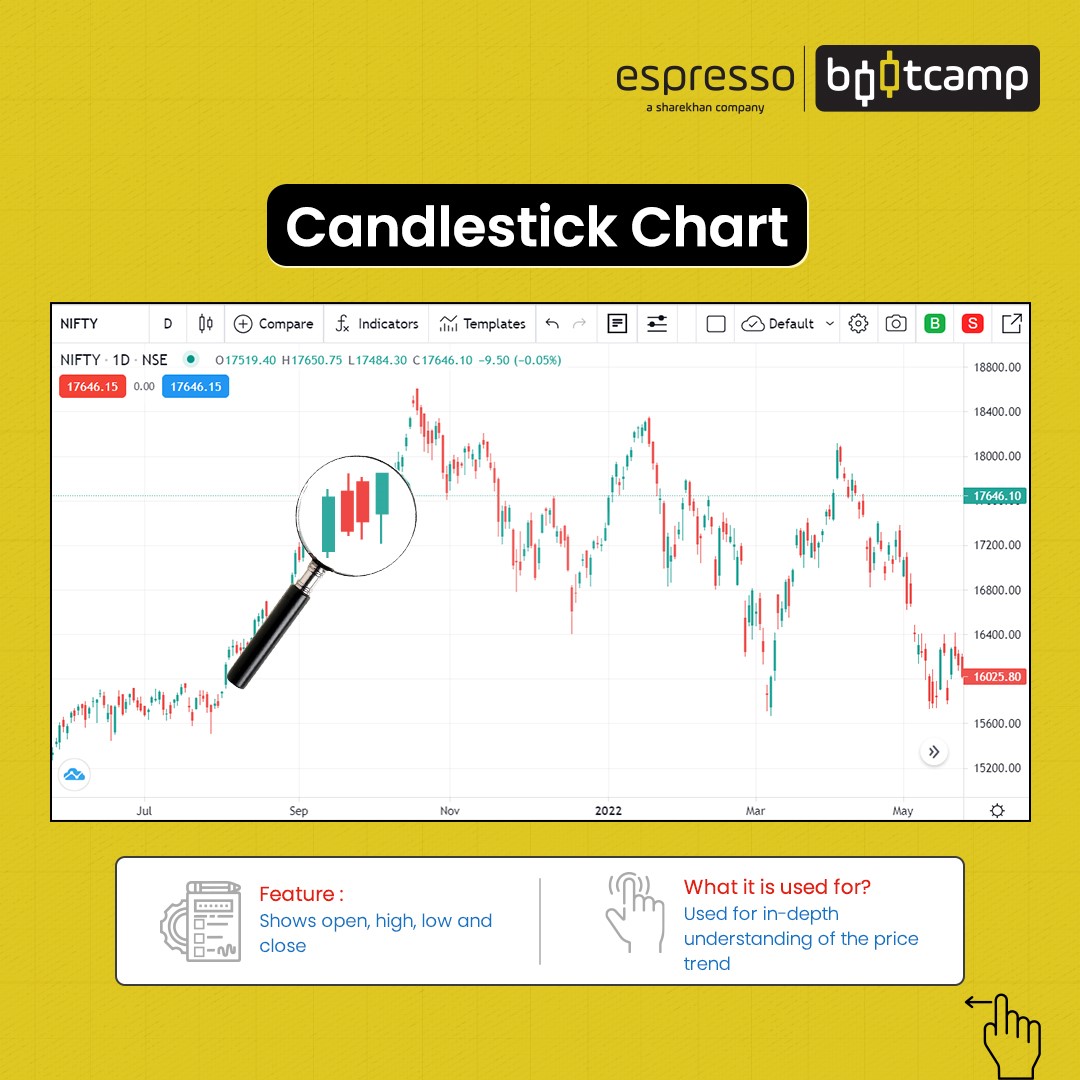
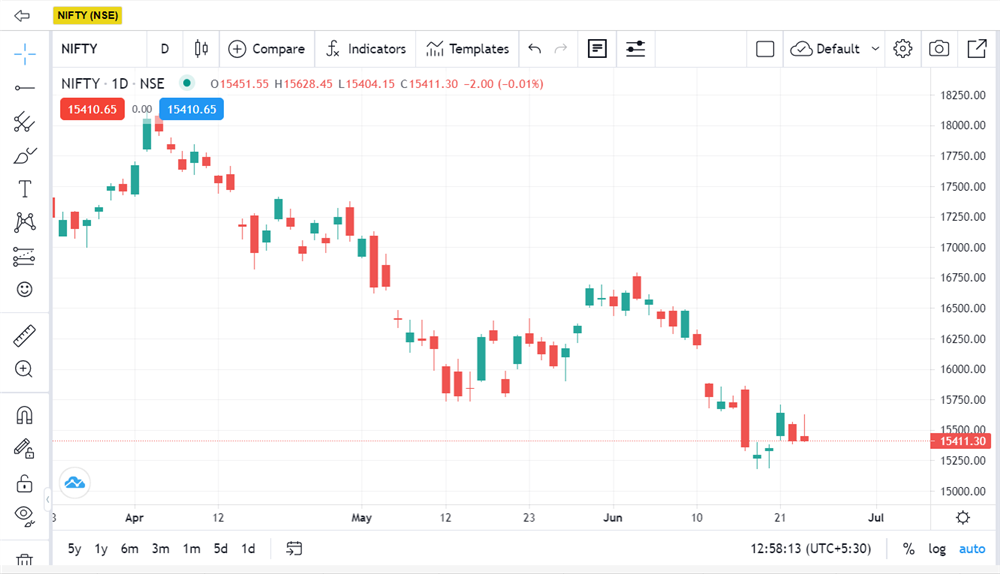
Candlesticks charts
- It was introduced by a Japanese rice trader, Munehisa Homa, in the 18th century.
- The pattern is named so because it resembles a candle.
- It has a thick body with wicks on top and bottom of the candle, known as shadows.
- Similar to bar charts, candlestick charts also carry information about the open, high, low and close for the day or accounting period.
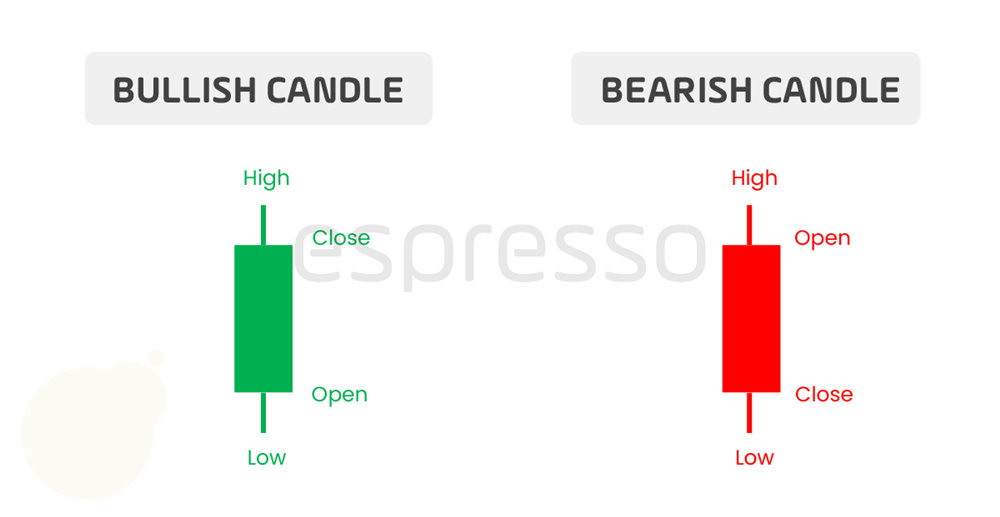
- The body of the candle is positive green or bullish if the close is greater than the open of the day or period.
- It is negative red or bearish if the close is less than the opening.
- If the open and close are the same, then the colour of the previous candle is the colour of the current candle.
- The top of the wick is the high of the day.
- The bottom of the wick is the low of the day.
However, there are some peculiarities to a candle. This pattern has body language that conveys different meanings. Candlesticks are the most popularly used charting method by technical analysts for trading. Many patterns are either based on single candles or two or more candles forming a pattern.
A single candle pattern like a Doji, hammer, shooting star, Marubozu, hanging man, etc., are trend reversal patterns that convey the reversal of an existing trend. Candlestick patterns of two or more candles like the harami, engulfing, morning or evening stars, 3 white soldiers or 3 black crows, etc., are also trend reversal patterns.
We will learn more about these patterns as we go along further.
Other chart types
There are other chart types used by technical analysts. These are Renko, point & figure and Heikin Ashi. These are known as noiseless charts as they filter or ignore small price movements.
Renko charts
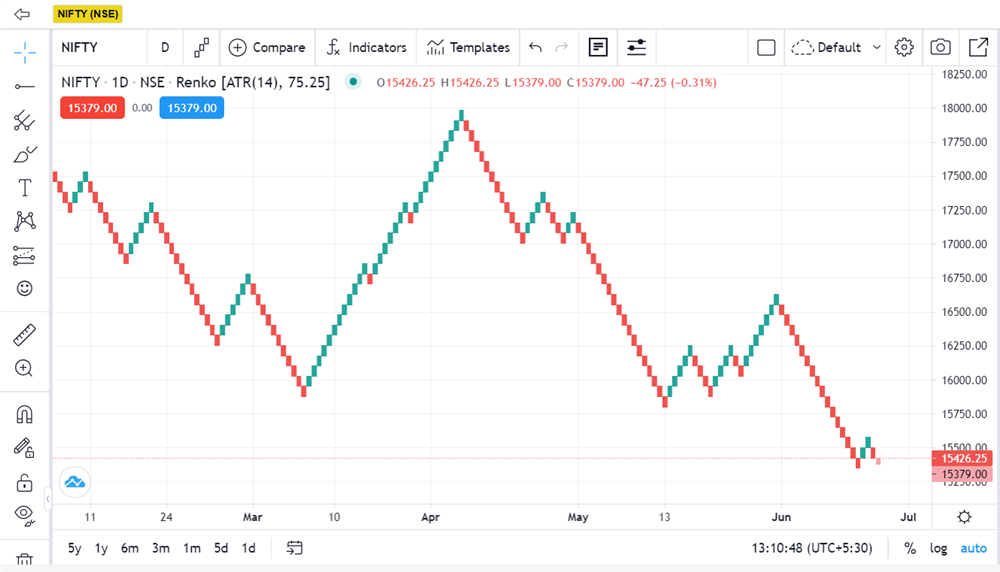
- Renko charts focus only on price changes and ignore the time axis.
- They use bricks that are either hollow or filled.
- A brick is made of a pre-defined value.
For example, if a value is set at 10 points, a brick will be made only if there is a movement of 10 points or more. At every 10 or more points, a new brick will be made. Smaller prices that move below 10 points are also ignored.
Point & figure charts
- It is regarded as one of the oldest and most popular charting techniques.
- It was prevalent before computers took over charting.
- It is a simple method where Xs and Os are plotted in a column.
- Xs represent the rising trend.
- Os represent a falling trend.
- The Xs and Os are plotted on a fixed price movement known as the box value.
For example, if you decide on a box value of 10, an X will be plotted only if the price moves by 10 or more. Similarly, if the price falls below 10 or more, only then an O will be plotted in the next column. Xs and Os will always be plotted on separate columns. This chart is also not dependent on time.
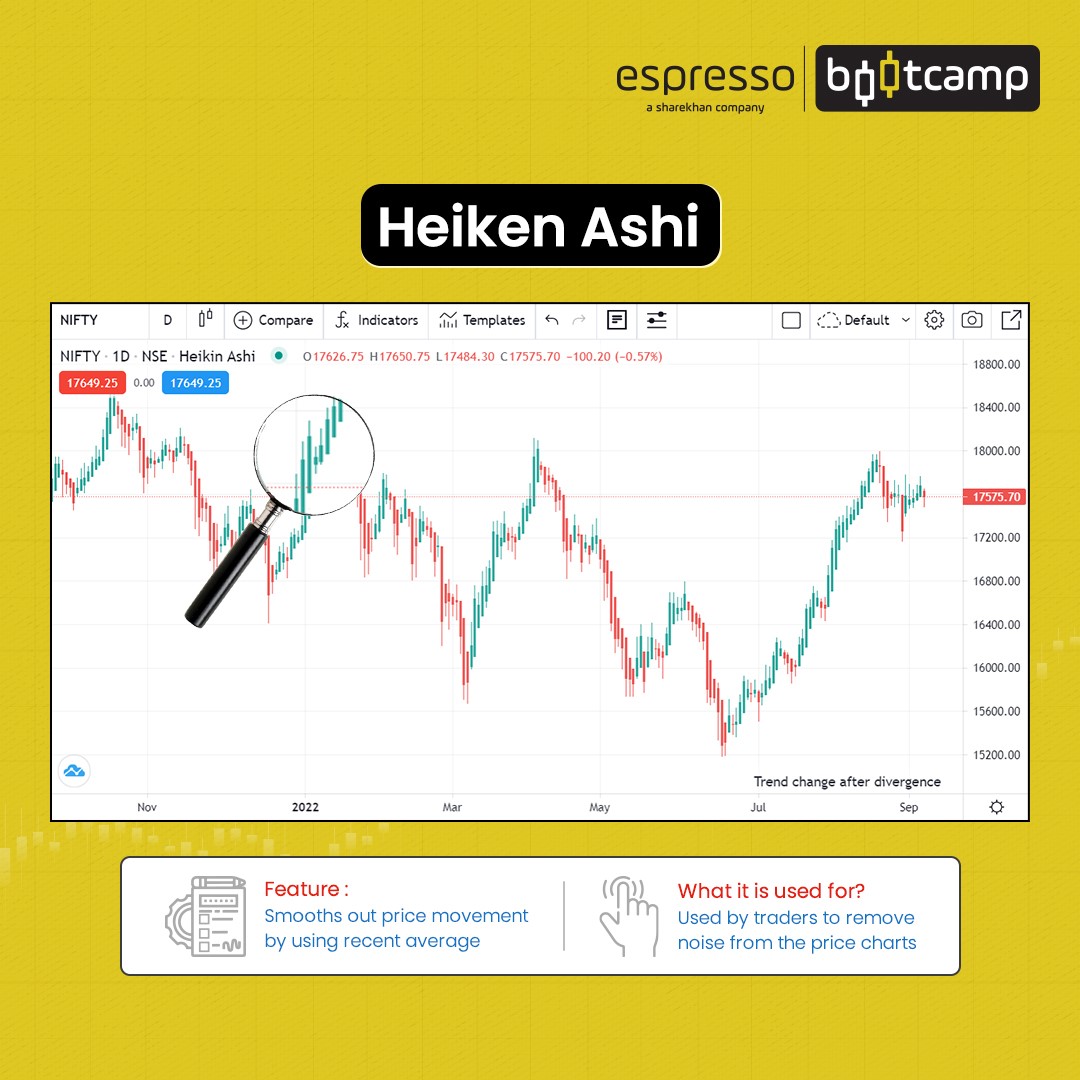
Heikin Ashi charts
- It is a Japanese-developed chart used by traders to smoothen the noise in the markets.
- While a normal candlestick chart is constructed by using four prices, i.e., the OHLC, Heikin Ashi uses prices of the previous candle to construct the candle.
- Heikin means average, and Ashi means pace. Therefore, it is a candle that is average-paced.
- It uses a combination of averages of the previous candle and the current candle to derive the current candle.
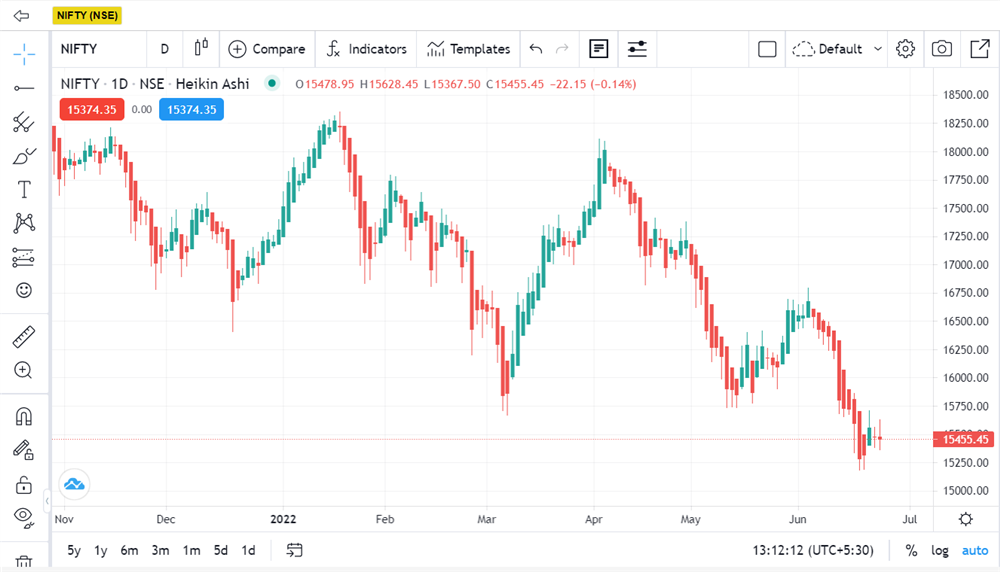
All four prices, i.e., OHLC, are derived. Open is the average of the open and high of the previous candle, while the close is the average of OHLC of the current candle. High is the average of OHC, while low is the average of OLC.
The main advantage of a Heikin Ashi chart is that the rally of the green and red candles is much longer than the normal candle sticks.
We will learn about these charts in greater detail as we move forward.
Points to remember:
- Charts can help traders and investors to analyse the price and volatility in different time frames.
- Candlestick charts help in providing detailed information about the price of a security.
- Noiseless charts simplify and filter the data.
 0
|
0
|
 0
0

