
 Watch
Watch We learnt how to interpret candlestick charts in the previous chapter. It is now time to learn more about interesting aspects of this popular chart pattern. Candlesticks can be analysed based on a single candlestick pattern or multi-candle patterns.
- So what is a one candle stick pattern in technical analysis? A single candlestick pattern is usually a reversal pattern.
- Multi-candle patterns can be both a reversal and continuing pattern.
Traders look for clues in price action, which can signal a shift in the market sentiment or trend – known as a reversal. They use these single candlestick patterns and multi-candlestick patterns to identify potential entry or exit opportunities.
You must understand that every reversal need not be a trend-changing move. Markets take a breather, at times, before continuing with the original trend. These patterns are likely to change trends, and the trend does not have to reverse.
We will also look into the reversal patterns popularly used by technical traders through this course.
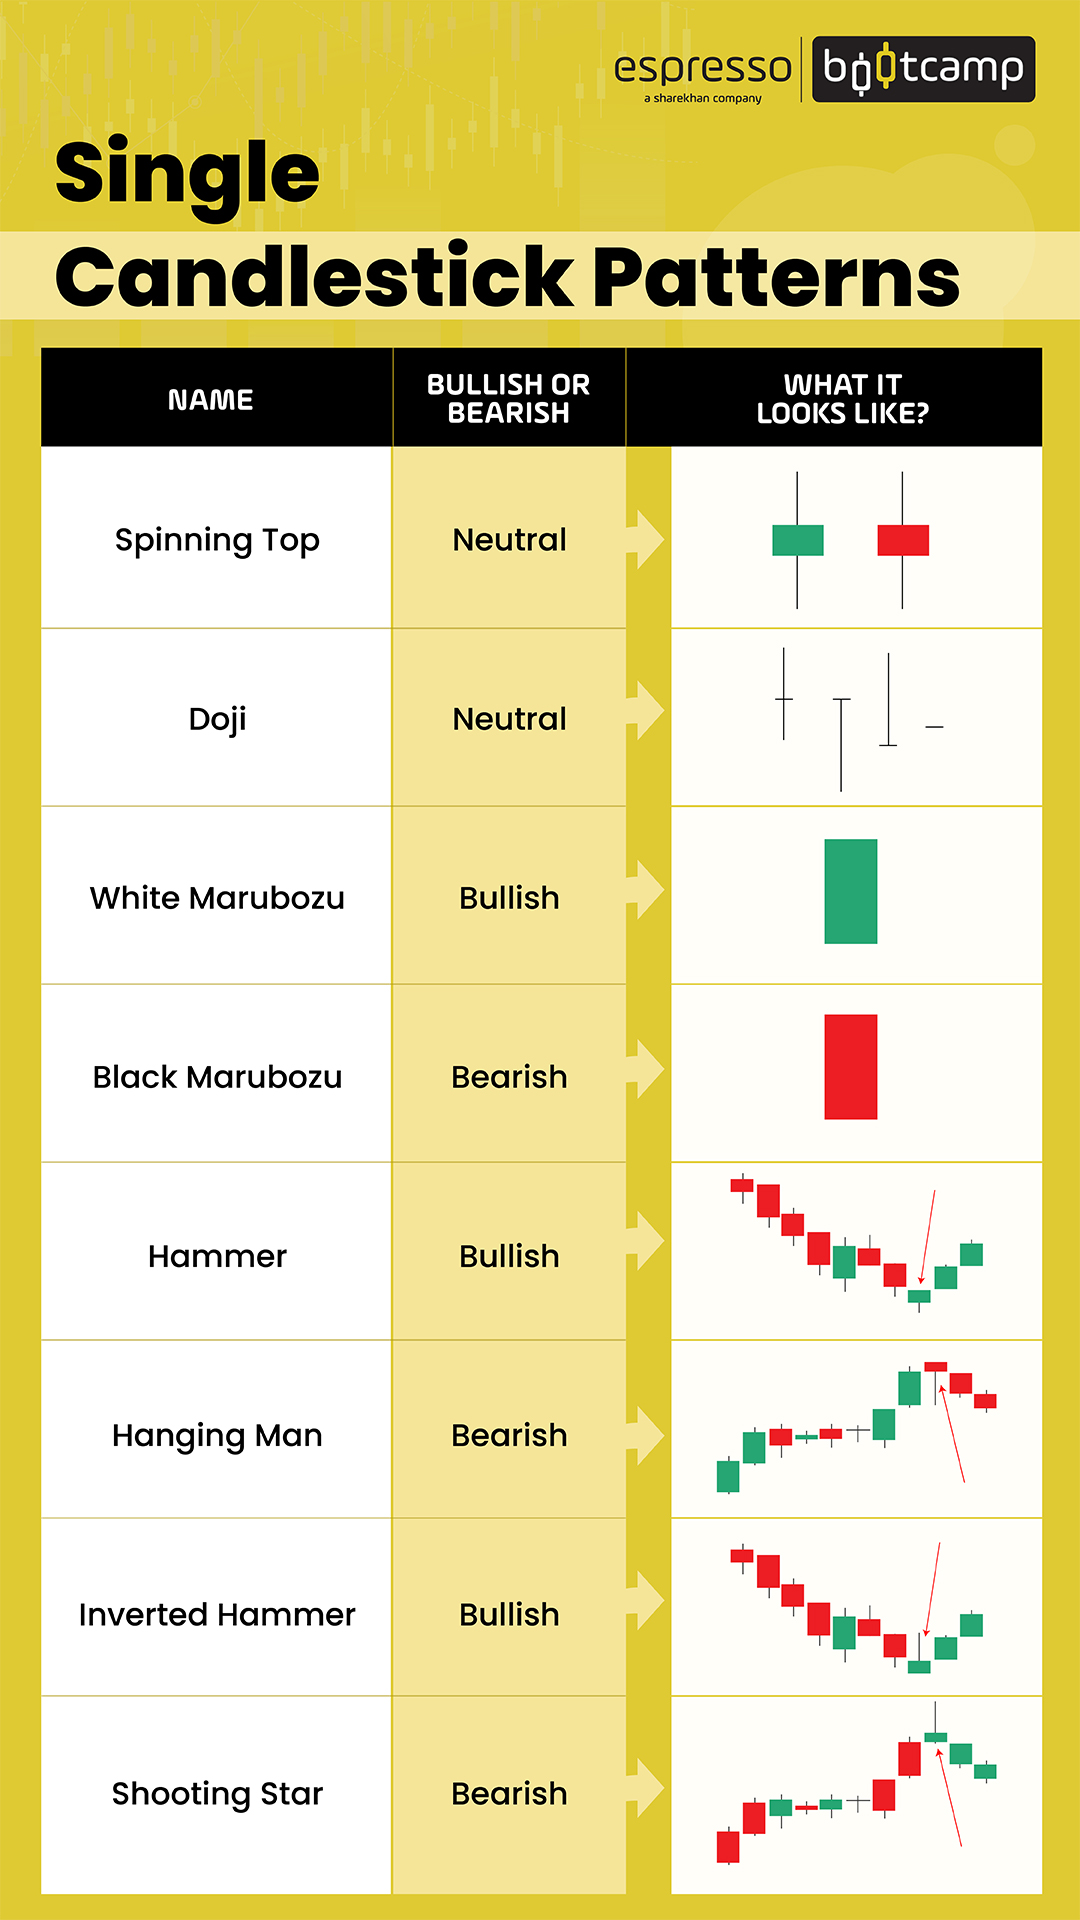
Single candlestick reversal patterns
In this pattern, only a single candle gives a signal of a probable reversal. The most popular ones include:
- Hammer and hangman
- Shooting star and inverted hammer
- Doji and its variants
- Spinning top and bottom
- Bullish and bearish Marubozu
- Belt-hold lines
Let’s understand some of the key ones in detail:
Hammer & hangman
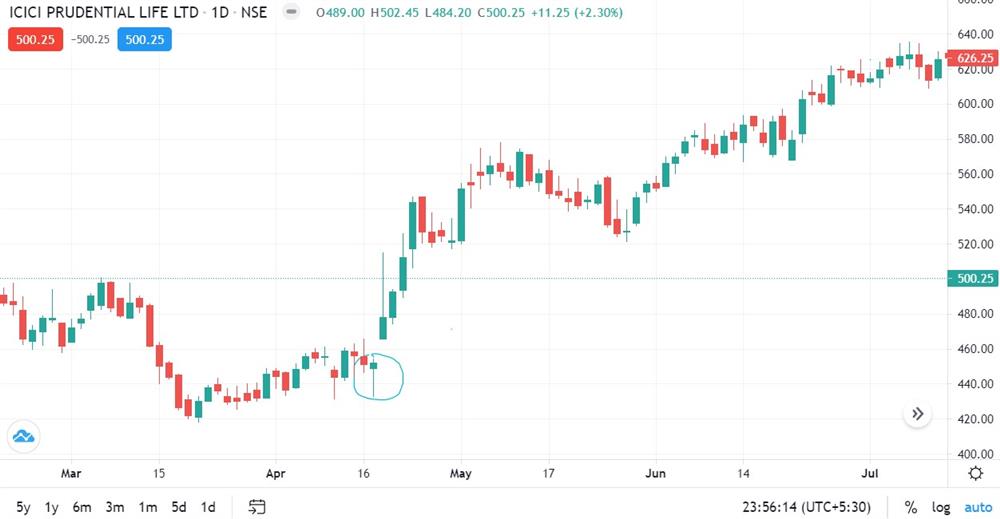
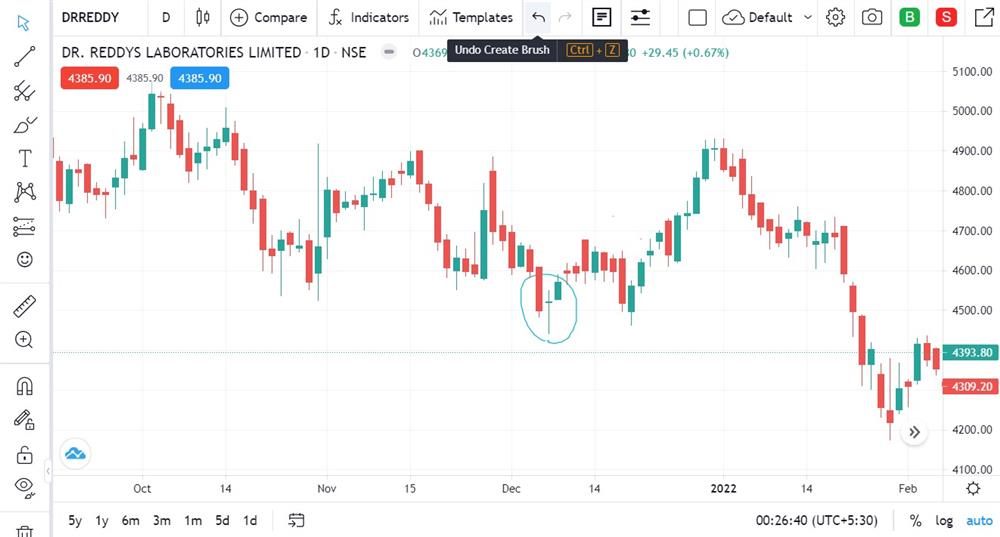
Hammer is a single candlestick pattern whose body is small at the top end of the candle, and the lower shadows are long. After opening, it moves down sharply but recovers and closes well above the low. If it appears at the bottom of a downtrend, it signals the end of the trend.
A hangman, on the other hand, appears after an uptrend that signals the end of the rally. It is named so as it resembles a hanging man with dangling legs.
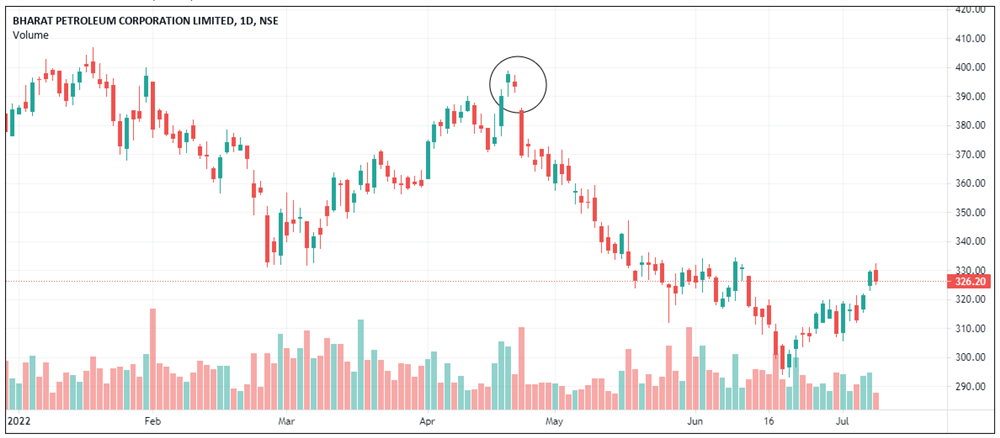
It’s interesting how a hanging man pattern works. The hanging man candle opens near or at the high of the day and, thereafter, sees a sharp selloff. It then rallies back again to close near the high. The next day, however, the market opens lower, and traders who have bought at the close of the previous candle are left high and dry – they’re left hanging.
Three points to be noted in a single candlestick pattern:
- The real body should be near the top of the candle.
- The lower shadow should be twice the length of the upper body.
- The top should have either no or a very small upper shadow.
The colour of the hammer does not matter. However, if a hammer is green, it is more bullish, while if a hangman is red, it’s obviously more bearish.
Doji and its variants
Doji is one of the most important reversal patterns. This is a single candlestick pattern in which the opening and closing prices are the same - ones within a very small range will also qualify.
Doji indicates uncertainty between the bulls and the bears therefore, the opening and closing are almost the same. A Doji appearing at the top after a long bullish candle has a high probability of reversal. Uncertainty during an uptrend is unsustainable. However, Doji in a downtrend may not indicate a reversal. A falling market is like a falling knife, and it is not advisable to catch it. Indecisiveness in a downtrend can cause the market to fall on its weight.
Long-legged Doji
This is a Doji pattern, which has long upper and lower shadows indicating indecisiveness. This single candlestick pattern is marked by volatility before the closing price settles at or near the opening price.
A long-legged Doji appearing after a downtrend can be a bullish reversal, and if it appears after an uptrend, it can be a bearish reversal.
Gravestone Doji
This Doji is most bearish as it opens and closes at the low of the day. It is bearish as the market opens low, then rallies to the high of the day but fails to sustain, only to plunge to close at the low of the day. This Doji has a long upper shadow, indicating a negative emotion.
Spinning top and bottom
This single candlestick pattern, similar to the Doji, is indecisive. It has both upper and lower shadows with a small body. A spinning top appearing after a bullish or a bearish rally indicates a pause. Before trading with this pattern, one must confirm it with the next candle’s opening.
Bullish and bearish Marubozu
Marubozu, in Japanese, means ‘shaven head’. These candles, both bullish and bearish, do not have shadows. They are identified as long rectangular candles devoid of shadows.
In bullish Marubozu, the open and low are the same, and so are the close and high. A bullish Marubozu at the end of a downtrend can mean its reversal. One must be careful, as a bullish Marubozu at the end of an uptrend can mean a continuation of the uptrend.
In a bearish Marubozu, the open and high are the same, and so are close and low. A bearish Marubozu at the end of an uptrend can mean a possible reversal of the uptrend, and at the end of a downtrend can mean a continuation of the downtrend.
Belt-hold lines
The Japanese name for the belt hold is Yorikiri, which, in sumo wrestling, means pushing your opponent out of the ring by holding his belt. Belt-hold candles can be both bullish and bearish.
A bullish belt-hold line is a long positive candle with a very small or no lower shadow. This means the price opens at low but recovers and trades higher for the rest of the day. If this appears after a downtrend, it is a possible sign of reversal.
A bearish belt-hold is a long negative single candlestick pattern with a very small or no upper shadow. This means that the price opens at high but does not sustain and plunges to trade lower for the rest of the day. If this appears after an uptrend, it is a possible sign of reversal.
Points to remember:
- Single candlestick patterns often indicate a trend reversal.
- Some reversals may not change the trend completely as markets may just take a breather.
 0
|
0
|
 0
0

