
 Watch
Watch You may wonder if the Dow Theory has anything to do with Dow Jones, the stock market index in the US. Pat yourself on the shoulder, as your hunch is correct. Here’s the story.
Charles Dow, the founder and editor of the Wall Street Journal, propounded the Dow Theory through a series of editorials from 1900 to 1902. It wasn’t known as Dow Theory then. After his death in 1902, his successor, William P Hamilton, organised and developed these editorials into a theory that we know as the Dow Theory.
Dow was also the co-founder of Dow Jones and Company with Edward Jones and Charles Bergstresser. He is also credited with creating two stock indices known as the Dow Jones Transportation Average (DJTA) and the Dow Jones Industrial Average (DJIA).
The Dow Theory
The Dow Theory is based on identifying a trend and confirming it. Even today, this simple theory is widely followed by technical analysts.
According to Dow Theory, a trend is in place if it breaches the previous top or bottom successively. This means a higher high and a higher bottom are formed in the case of a bullish trend, and a lower high and a lower bottom are formed in a bearish trend. Additionally, the two indices should also move in the same direction of the trend, i.e., both DJTA and DJIA should move in tandem to confirm a trend.
Dow used the example of waves to explain his theory. In one of his editorials, he wrote, “A person watching the tide coming in and who wishes to know the exact spot which marks the high tide sets a stick in the sand at the points reached by the incoming waves until the stick reaches a position where the waves do not come up to it, and finally recede enough to show that the tide has turned. This method holds good in watching and determining the flood tide of the stock market."
He also explained that DJIA and DJTA are the measures of the tide in two different parts of the beach. If the tide reaches point DJIA, it should eventually reach DJIA too. If not, then the trend is not confirmed. Both DJIA and DJTA are used to determine if the tide was coming in or going out all along the seashore, indicating both are an integral part of the Dow Theory.
Six tenets of Dow Theory in technical analysis
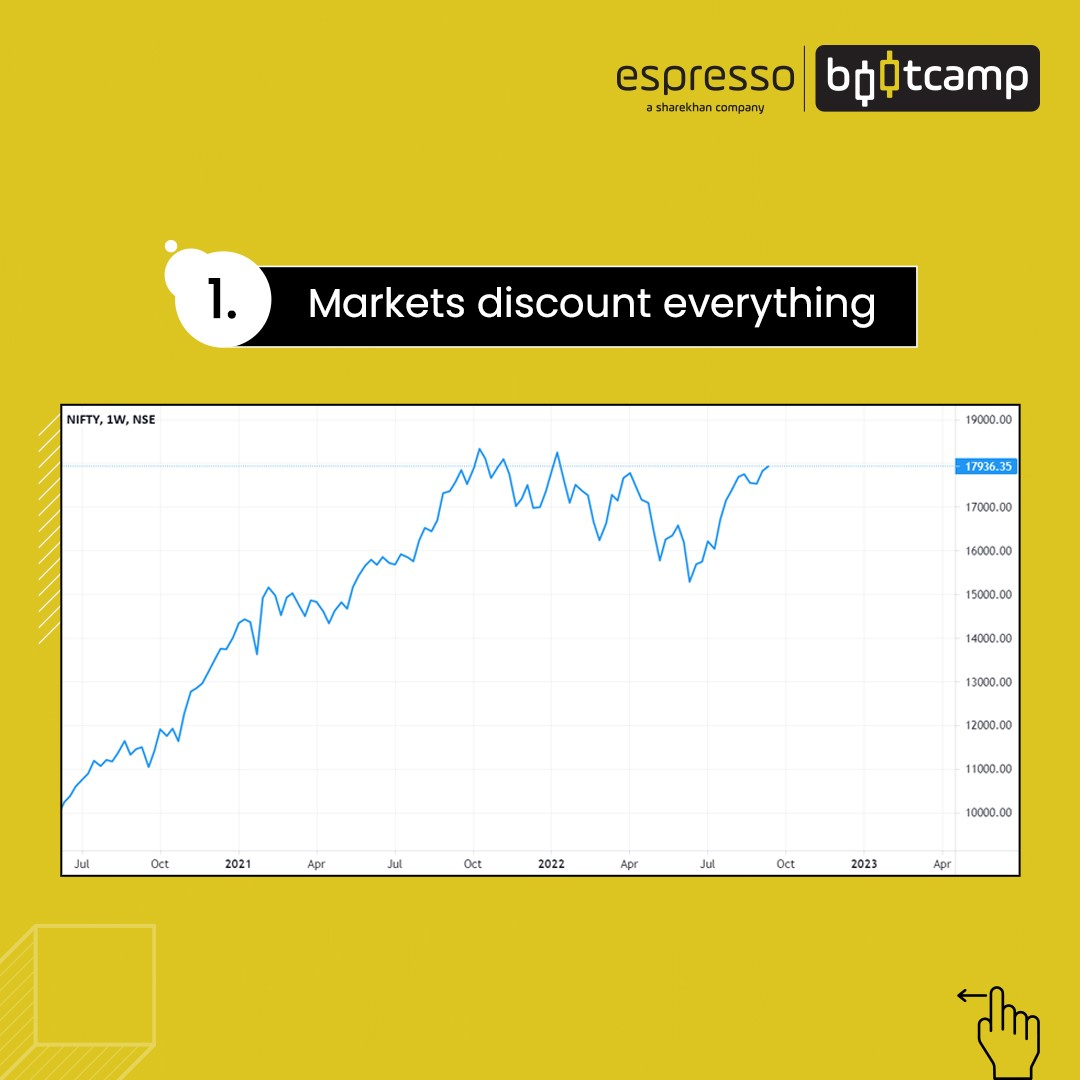
Markets discounts everything
The first tenet is based on the efficient market theory that says the market is an all-knowing entity, and all the information is discounted. Dow Theory says both the averages or indices, DJTA and DJIA, reflect all the available information that affects demand and supply. Even ‘acts of God’, such as natural disasters, are immediately discounted and reflected in the price.
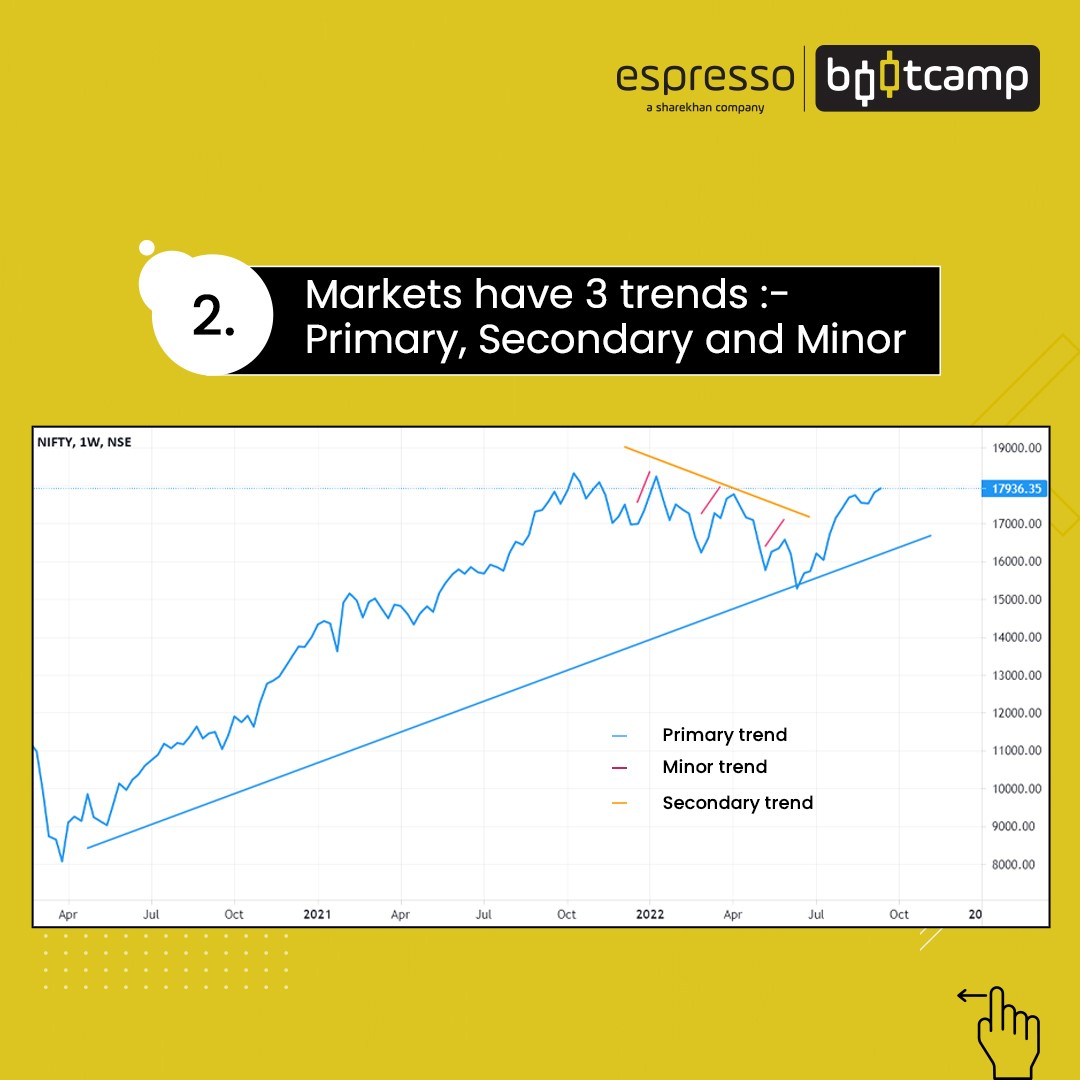
Three trends of the market
There are three trends in technical analysis pertaining to the market movement; primary or major trends, secondary trends and minor trends. Dow Theory compares the primary trends to an ocean tide, the secondary trend to waves and the minor trend to ripples.
- Primary or major trends: As mentioned earlier, the primary trend is like the wave that makes a higher high and a higher low for a bullish trend or a lower high and a lower low for a bearish trend. The primary trend can last for a year and can extend for several years.
- Secondary trends: Secondary trends are corrective movements in the opposite direction of the primary trend. This corrective move can last for three weeks to three months. The measure of retracement is more likely to be 50 percent of the previous move. It can also retrace by 1/3rd or 2/3rd of the previous move.
- Minor trends: The minor trends are fluctuations within the secondary trends and can last for less than three weeks.
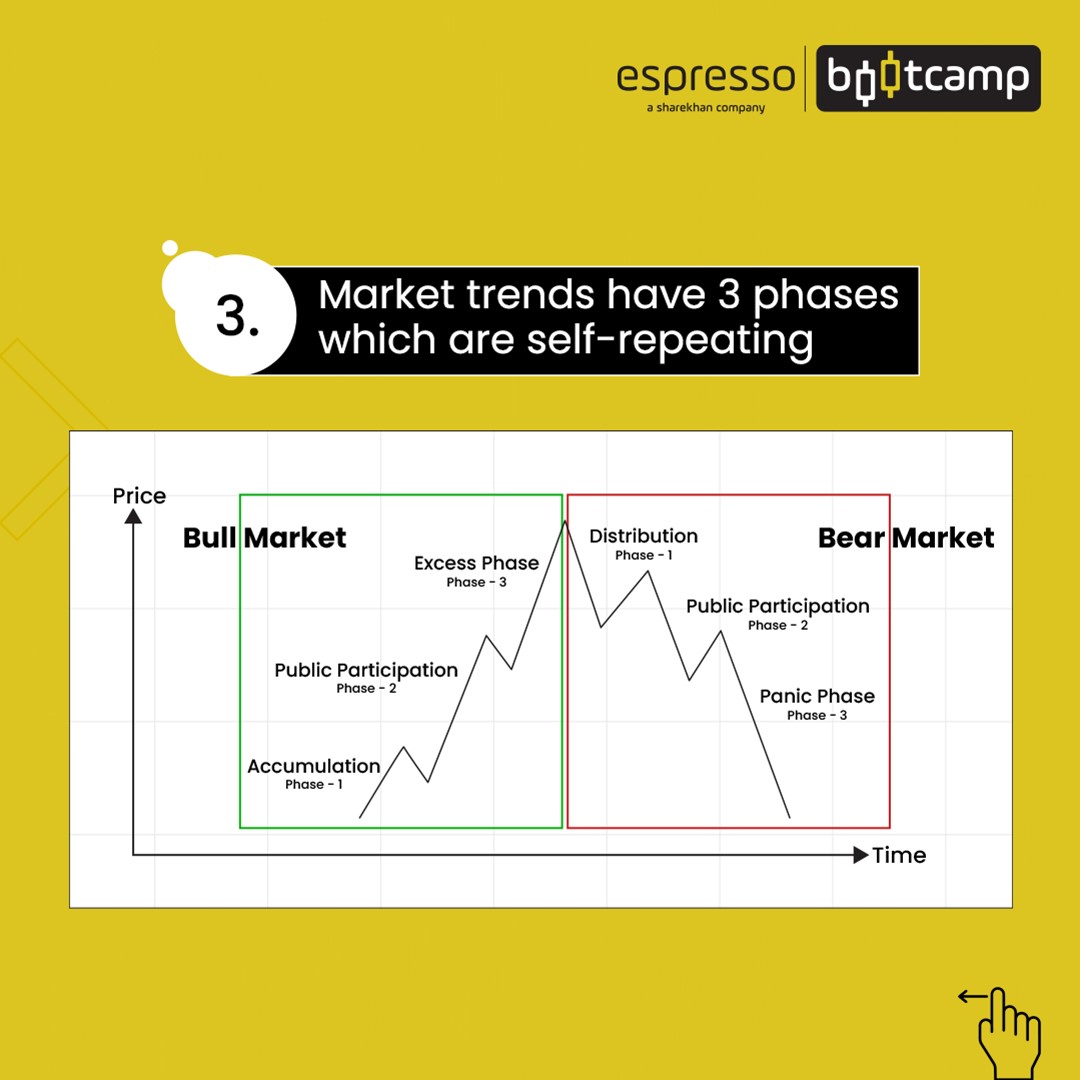
Three phases of the primary trend
According to this tenet, the primary trend has three distinct phases; accumulation, public participation and distribution. The accumulation phase is where a previous bear market trend has ended and informed investors have started accumulating or buying. The public participation phase is when the public joins the bandwagon and there is general euphoria. The distribution phase is where informed investors start selling off their positions as the euphoria reaches its peak and volumes of public participation increase.
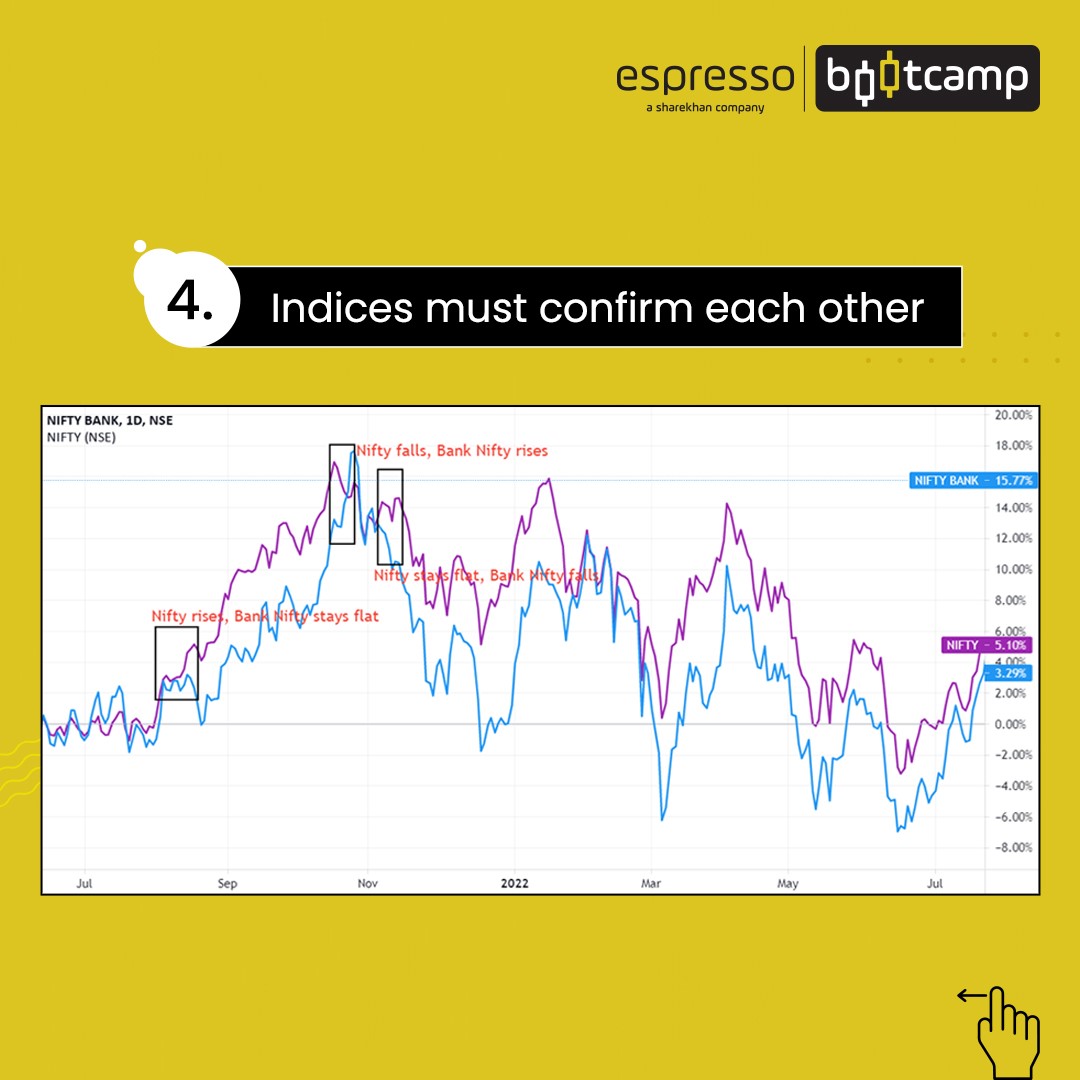
Indices should move in tandem
DJTA and the DJIA are the two indices that Dow used to confirm the trend. According to the theory, a bull market or a bear market trend cannot happen unless both indices or averages give the same signal or move in the same direction.
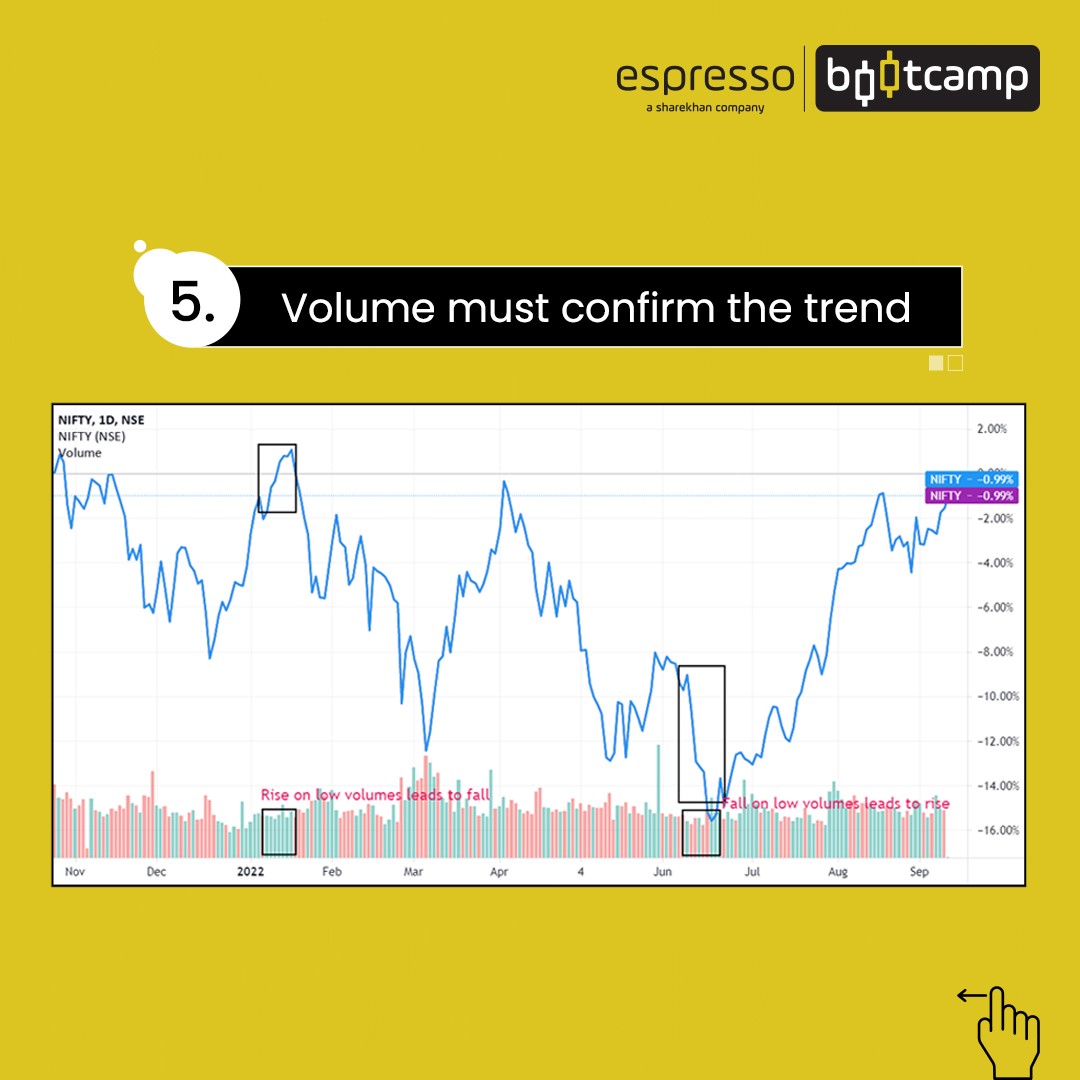
Volume should conform to the trend
According to this tenet, volume was an important factor. However, the price took precedence over volume. In a primary uptrend, the volumes expand as the price increases and contract as the price falls. While in a downtrend, the volumes expand as the price falls and contracts as the price increases. The volume thus confirms the direction of the trend.
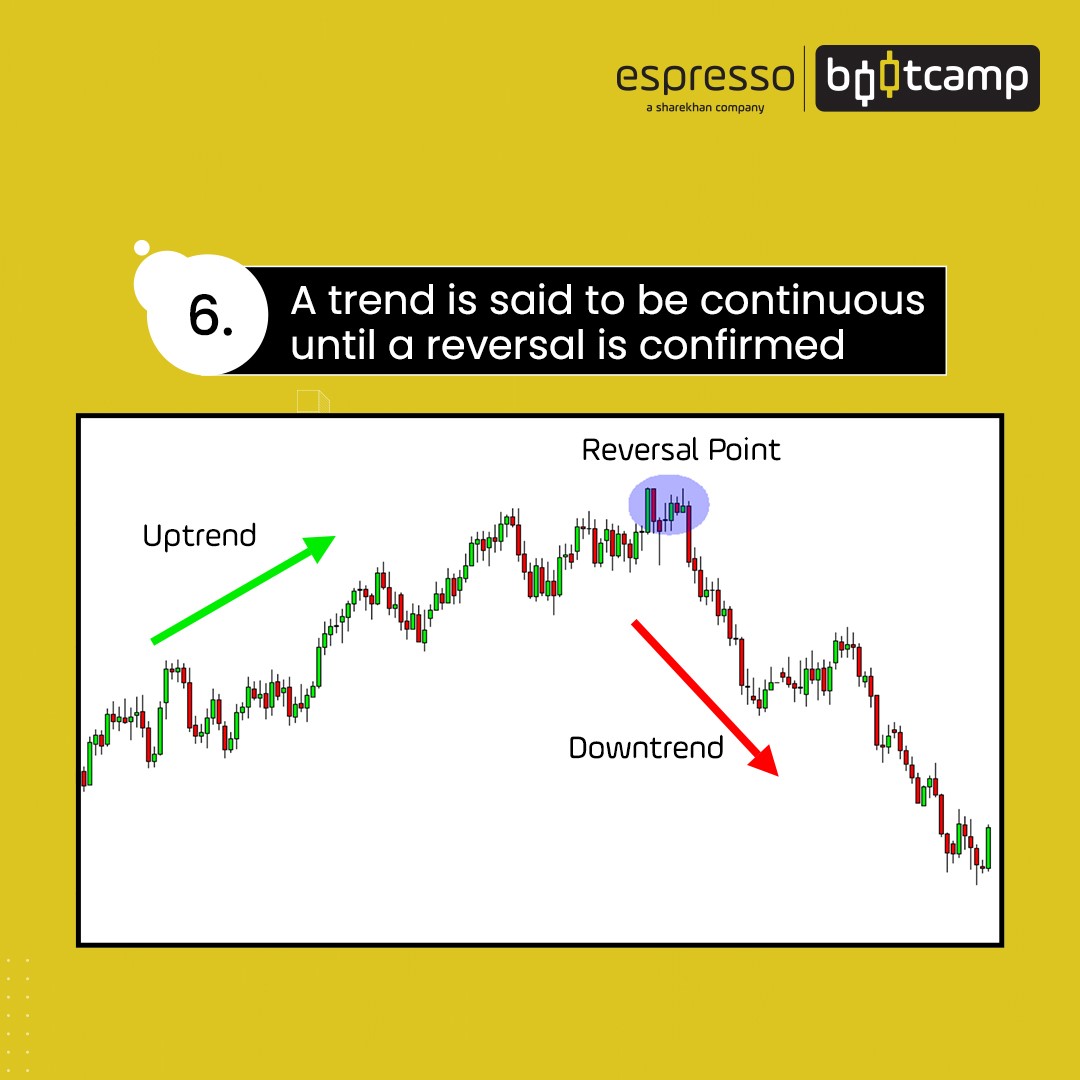
A trend is in place until a definite signal confirms a reversal
According to this tenet, a trend is most likely to continue until external cause changes or reverses their course. It is easier said than done, as one can confuse a secondary trend as a reversal and vice-versa. One needs to confirm a trend so as not to confuse it with a correction or reversal.
Now that you what is Dow Theory in stock market, let's quickly recap what we have learnt in this chapter.
Points to remember
- Despite being more than a century old, Dow Theory is relevant even today.
- It is a structure upon which modern technical analysis is built.
- There are, however, some difficulties related to identifying primary and secondary trends.
- Also, one cannot say when a trend has conclusively ended and one may have to rely on fundamental analysis as the reversal may be dependent on external factors.
- Though it gives a broad idea about trend identification, one must also use other technical analysis tools to confirm trends and reversals.
 0
|
0
|
 0
0

