
 Watch
Watch Like candlesticks, bar charts are also the most widely-used ones by traders.
Some of the distinguishing features of bar chart patterns include:
- Bar charts use open, high low and close or OHLC figures.
- They consist of a vertical line that represents the range of the price.
- The topmost point is the high of the price range, while the bottommost point is the low of the price range.
- Longer the bar, the higher the volatility, and the shorter the bar, the lower the volatility.
- There are two small horizontal lines attached to the left and right of the bar or line.
- The line left to the bar is the opening price of the bar, while the line right to the bar is the closing price.
- Four sets of prices make a bar.
- Like a candlestick chart, a bar chart also uses colours to represent positive or negative closing. For example, a positive bar will have a green colour and a negative bar will have a red colour.
Reading a bar chart

- Bar charts are plotted on a graph over the time parameter.
- They can be used for any timeframe - monthly, weekly, daily, hourly, and in other lower time frames like 1 minute, 3 minutes, 10 minutes, etc.
- These charts can be read by comparing bars; the current bar is compared to the previous one to understand if it is an up or a down.
- A bar is positive if it closes higher than the previous bar, while a bar that closes lower than the previous is negative.
- When a series of bars makes higher highs and closes higher, it implies an uptrend or bullish sentiment.
- A series of bars that makes lower lows and closes lower implies a downtrend or bearish sentiment.

The length of the bar also keeps changing depending on the price range. As buying interest increases, the bars become longer successively, and as it decreases, they become shorter. The reverse is also true for selling. As selling interest increases, the bars become successively longer, and as they lose interest, the bar becomes successively shorter.
A higher closing price than the previous bar indicates the buyers are having an upper hand, and lower closing than the previous bar indicates the sellers are stronger.
The location of the closing price also tells a story. If the closing is farther away from the previous bar, more intense is the control of the buyers or sellers. The closing in the range also conveys the mood of the buyers and sellers. If the closing is at the top of the bar, buyers are in control, and if the closing price is at the bottom of the bar, it implies sellers are in control. Closing near the middle can be due to profit booking.
Opening and closing prices also have importance in a bar chart. An opening price at the bottom of the bar indicates the buyers are in control. On the other hand, if the opening is at the top of the bar, it implies sellers are in control. If the opening and closing are in the middle, it implies equal control.

If both the closing and the opening form at the top, it implies the buyers have gained full control. On the other hand, if the opening and closing both are at the bottom, it implies the buyers have lost it to the sellers.

Bar chart patterns
Bar chart patterns provide excellent insights into the market mood. These patterns can be used to trade across timeframes but tend to be more reliable in higher timeframes.
Let’s look at some popular types of bar chart patterns in technical analysis:
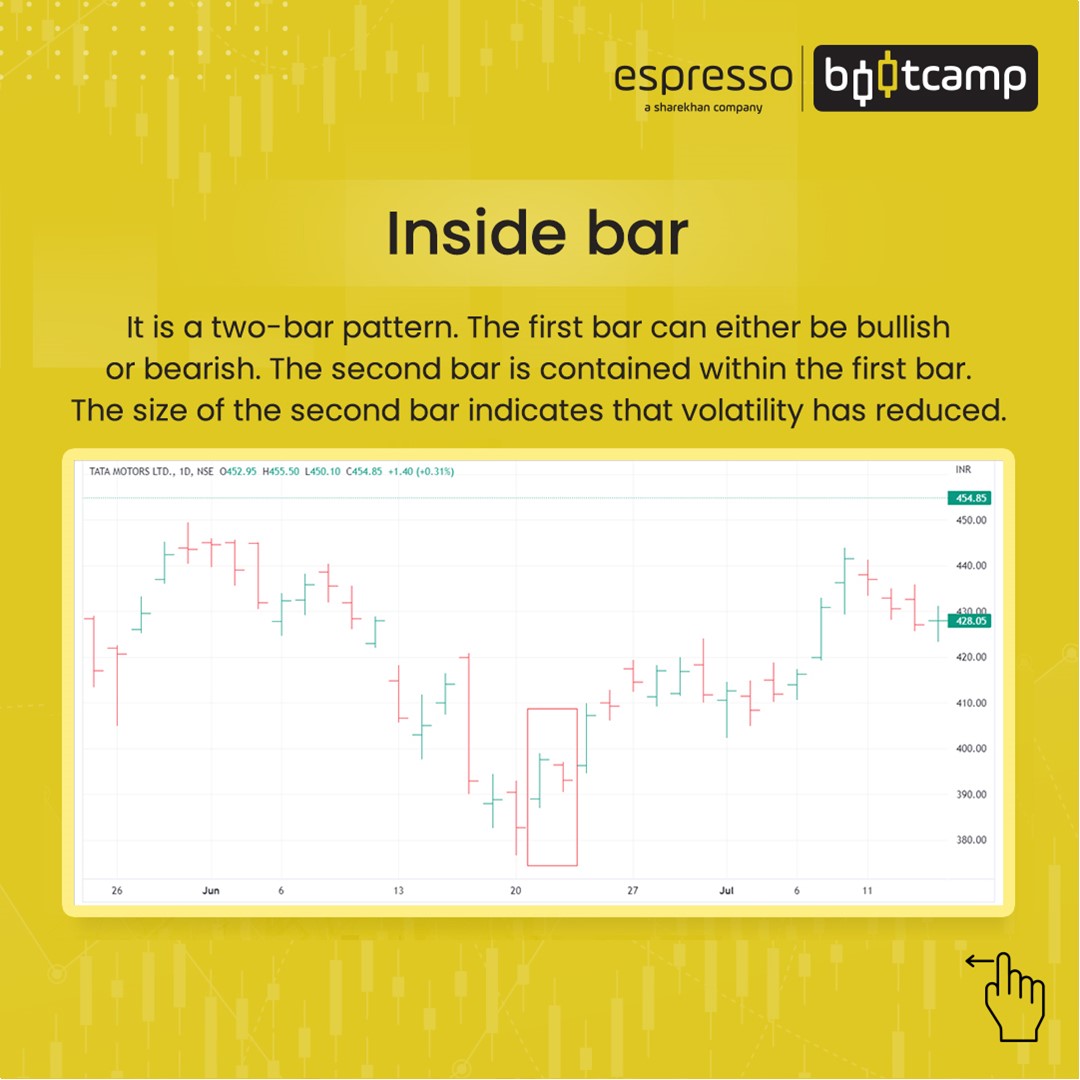
Inside bar
It is a two-bar pattern that can either be a continuation or a reversal pattern depending on where the prices break out. The first bar can either be bullish or bearish, and the second bar is contained within the first bar. This means the high and the low of the second bar are within the high and the low of the first bar. The size of the second bar indicates volatility has reduced.
Entering a trade depends on which side the price breaks out. If the price breaks above the high of the second bar, a long trade can be initiated. If the price breaks below the low of the second bar, a short trade can be initiated. An inside bar should be traded with a strict stop loss as it is prone to false breakouts.
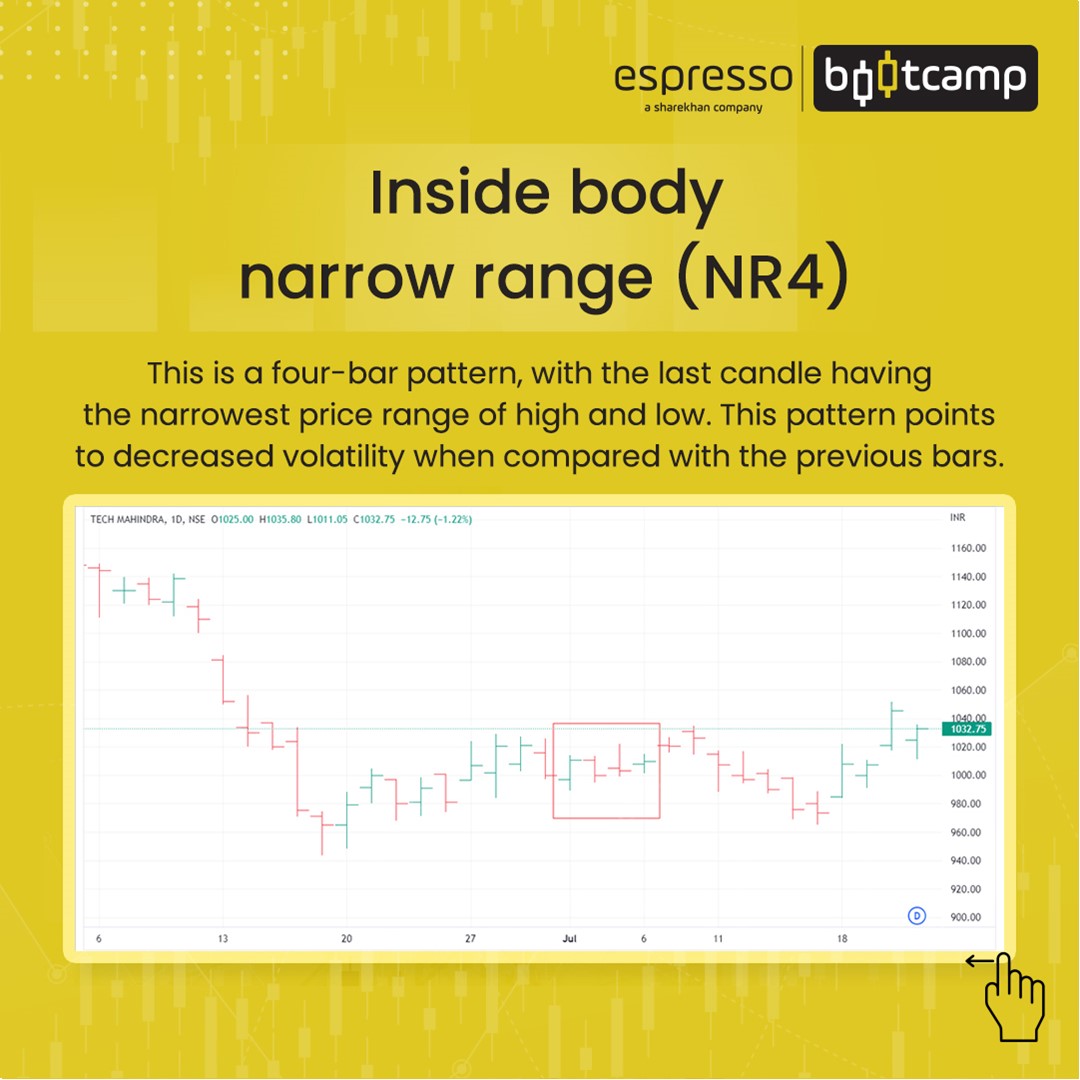
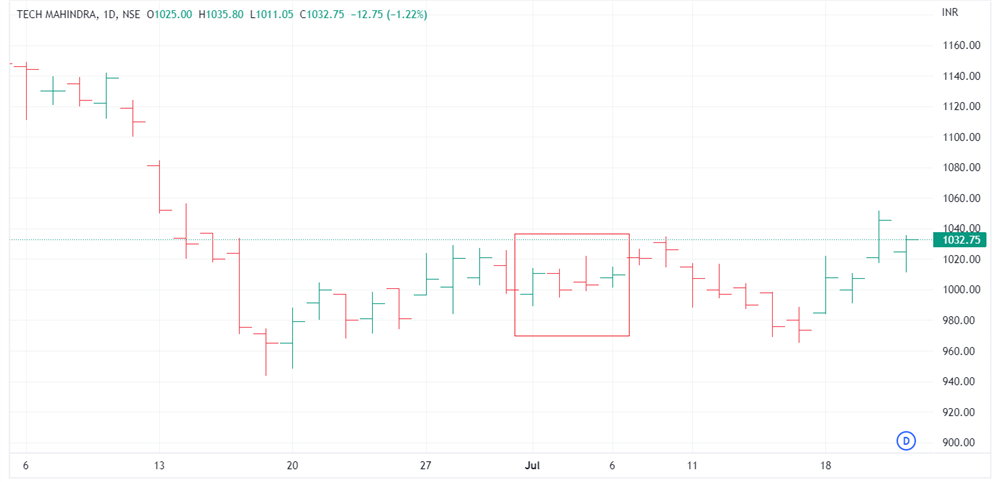
Inside body narrow range (NR4)
A variation of an inside body is known as narrow range 4 (NR4). This is a four-bar pattern, with the last candle having the narrowest price range of high and low. This pattern points to decreased volatility when compared with the previous bars. A trade can be initiated above the high of the narrowest bar or below the low of the narrowest bar. At this point, wait for the market to breakout on either side.
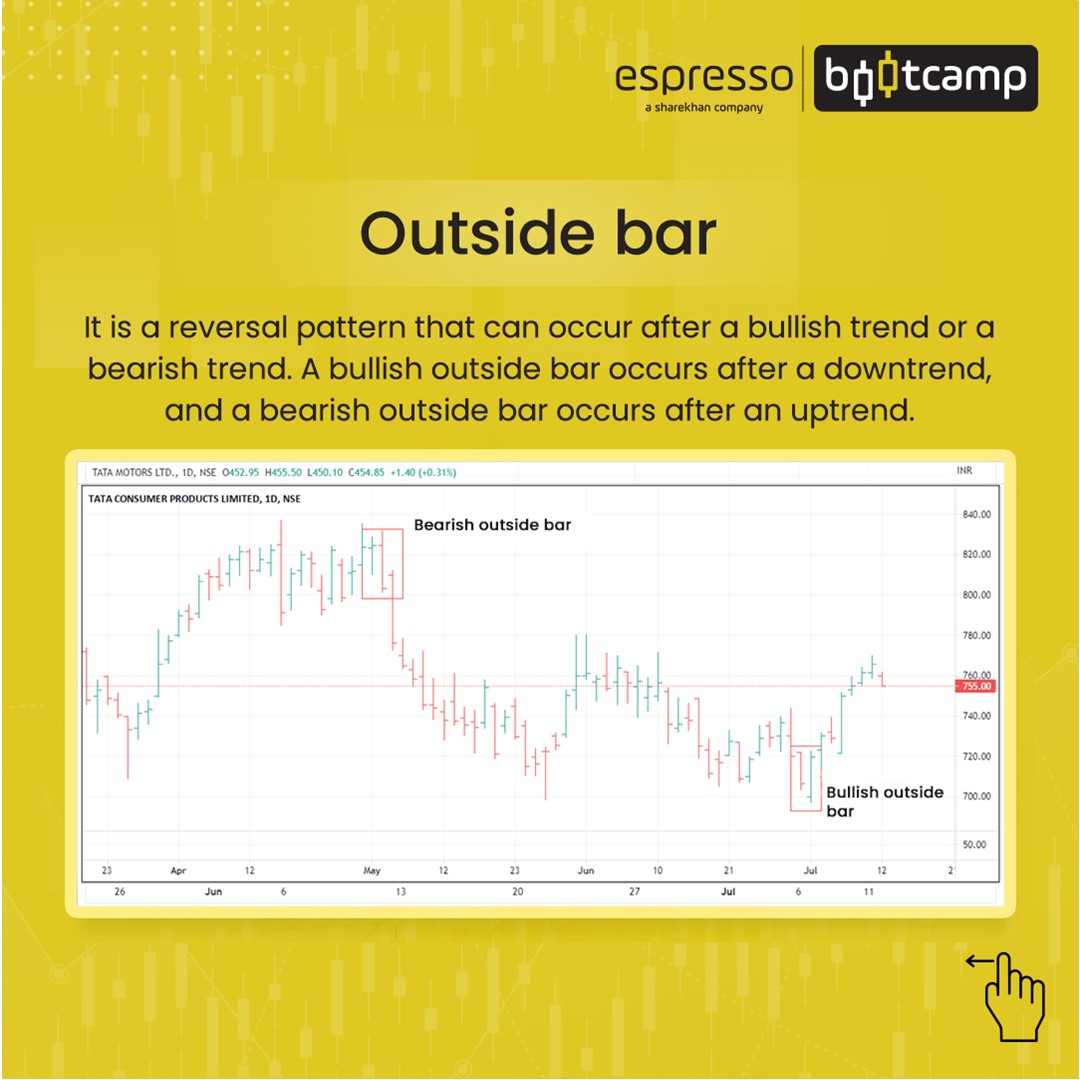
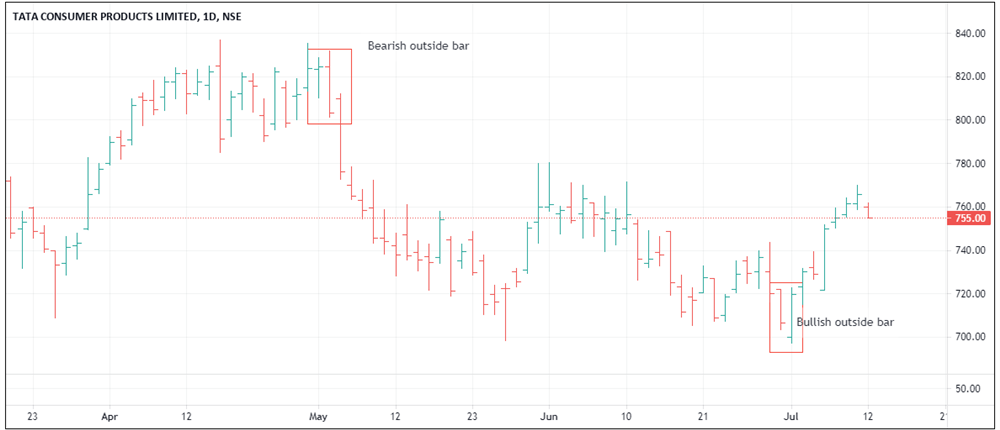
Outside bar
This pattern is similar to the engulfing pattern of the candlestick chart. This pattern is a reversal pattern that can occur after a bullish trend or a bearish trend. The idea behind this pattern is that the current trend is losing steam, and a reversal is possible. The preceding high range is contained within the outside bar. A bullish outside bar occurs after a downtrend, and a bearish outside bar occurs after an uptrend. The preceding high-low range is completely engulfed by the outside bar.
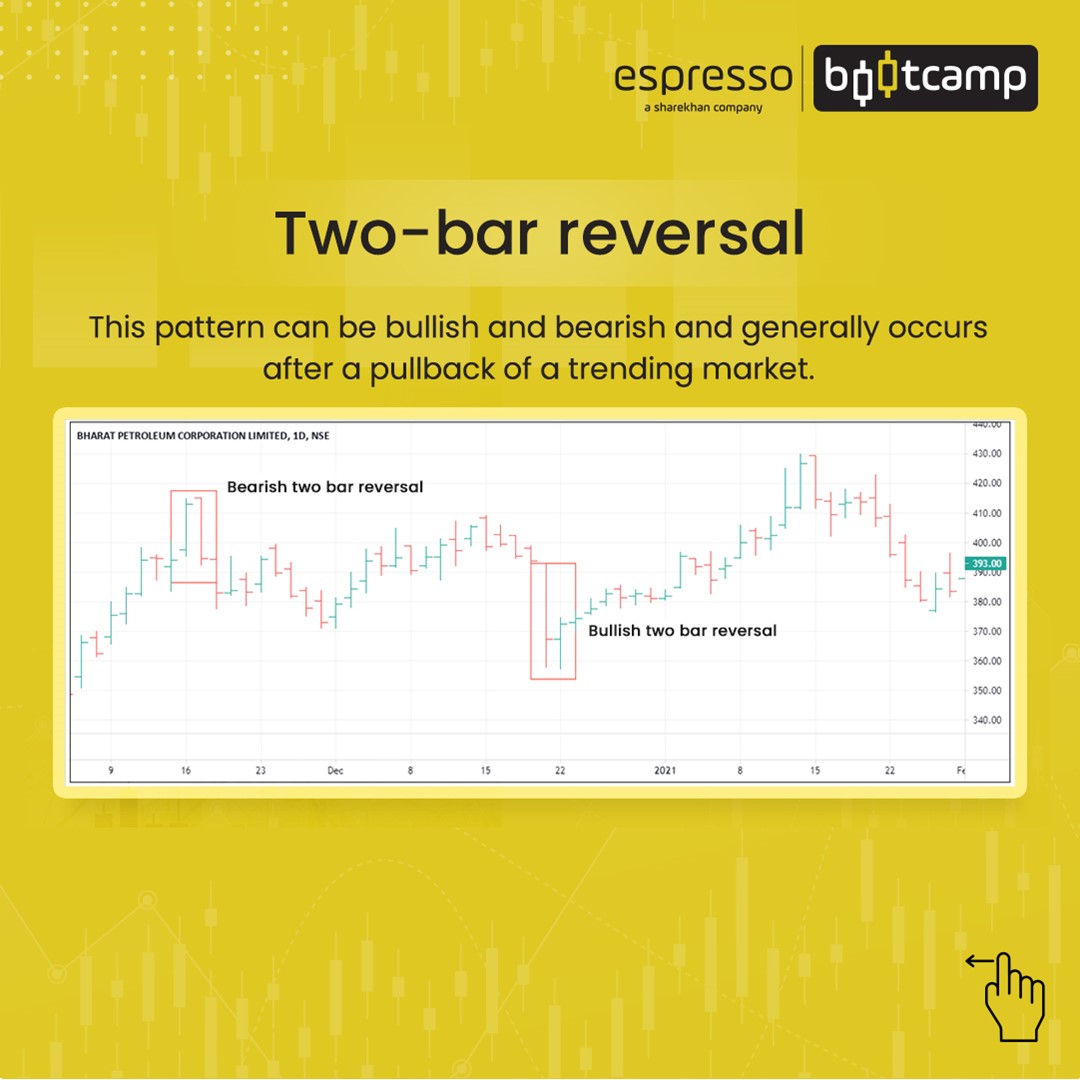
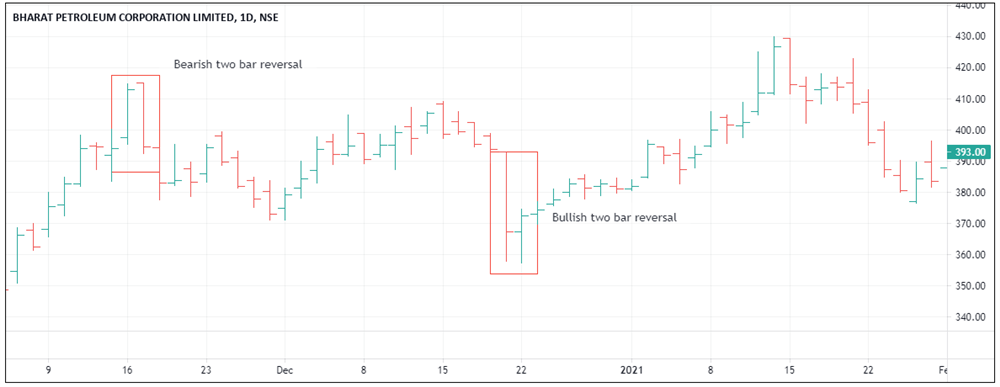
Two & three bar reversal pattern
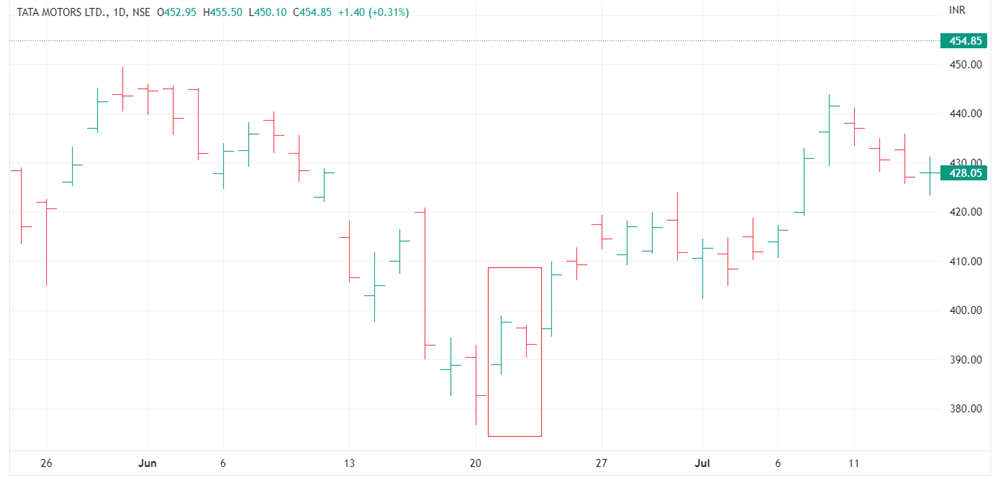
A two-bar reversal: This pattern can be bullish and bearish. A bullish two-bar reversal begins with a strong bearish bar, followed by a strong bullish bar, reversing the bearish sentiment of the previous bar. A bearish two-bar reversal begins with a strong bullish bar, followed by a strong bearish bar, reversing the bullish sentiment. This pattern generally occurs after a pullback of a trending market. A pullback, which gets halted at the support or resistance area, is the most probable area of this pattern.
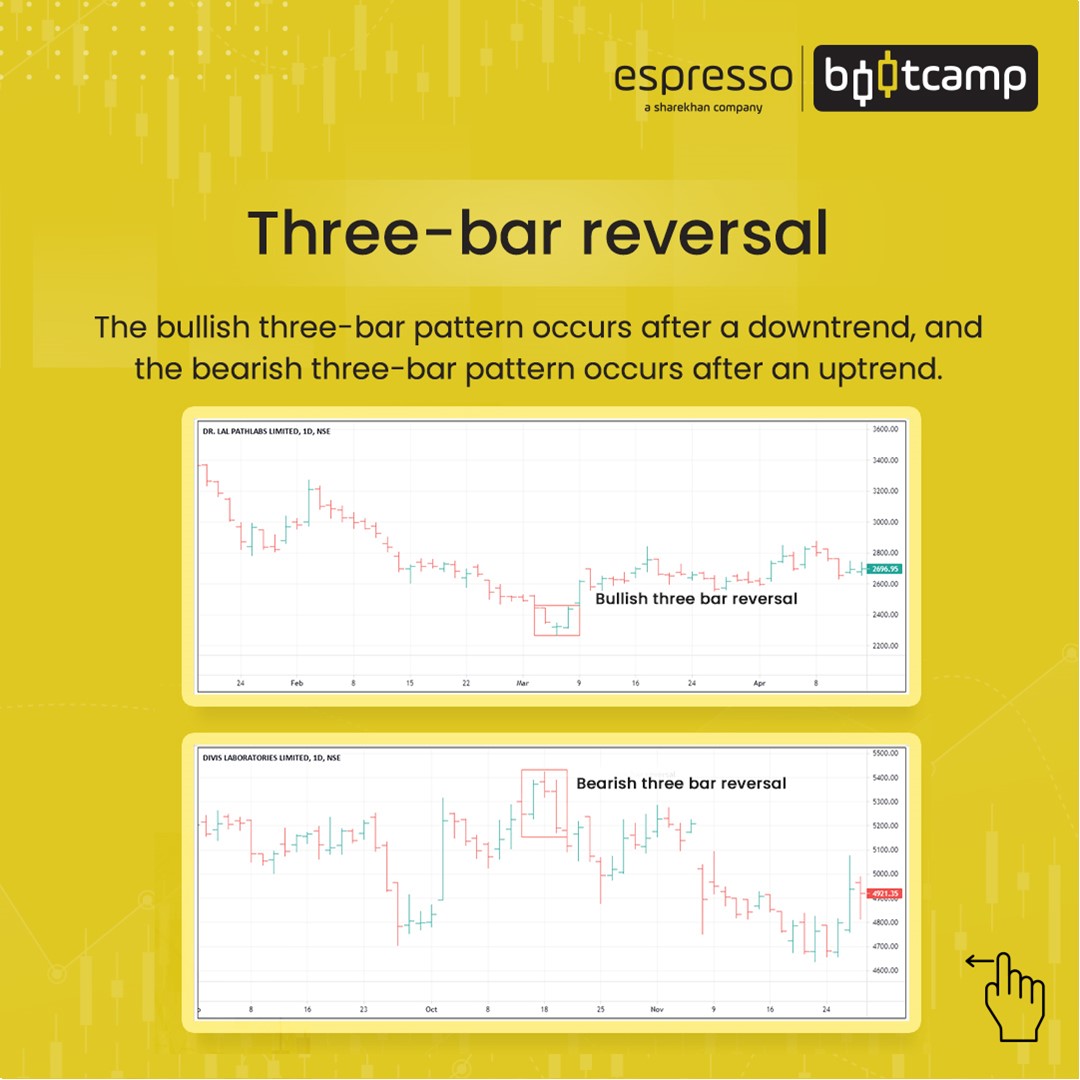
Three-bar reversal: This is similar to the outside bar pattern and consists of three bars as compared to the two bars. The bullish three-bar pattern begins with a strong bearish bar followed by a smaller bar. The close of the smaller bar is below the opening of the previous bar and is the lowest bar of the three. The third bar is a strong bullish bar that closes above the high of the previous two bars. This is similar to the morning star of the candlestick pattern.
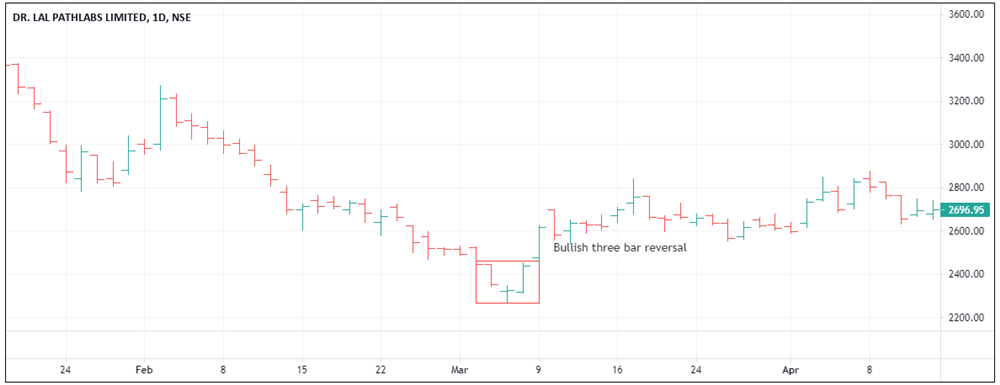
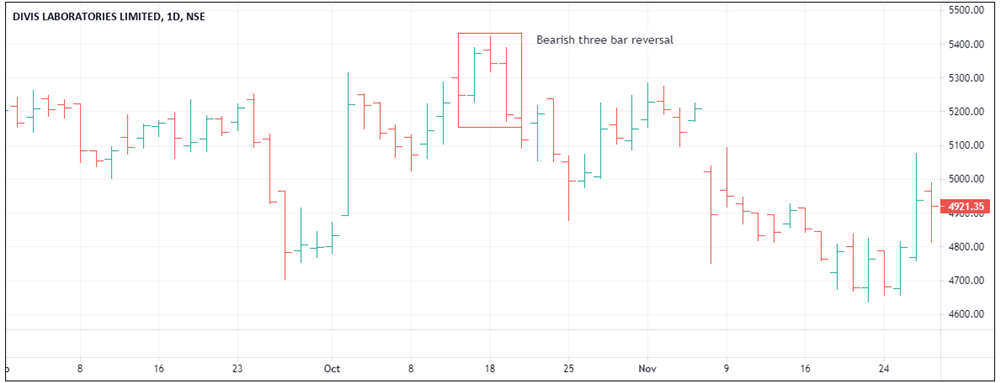
A bearish three-bar begins with a strong bullish bar followed by a smaller bar that closes above the opening of the first bar. The smaller bar will be the highest bar of the three. The third bar is a strong bearish bar that closes below the low of both the previous bars. This is similar to the evening star pattern.
The bullish three-bar pattern occurs after a downtrend, and the bearish three-bar pattern occurs after an uptrend.
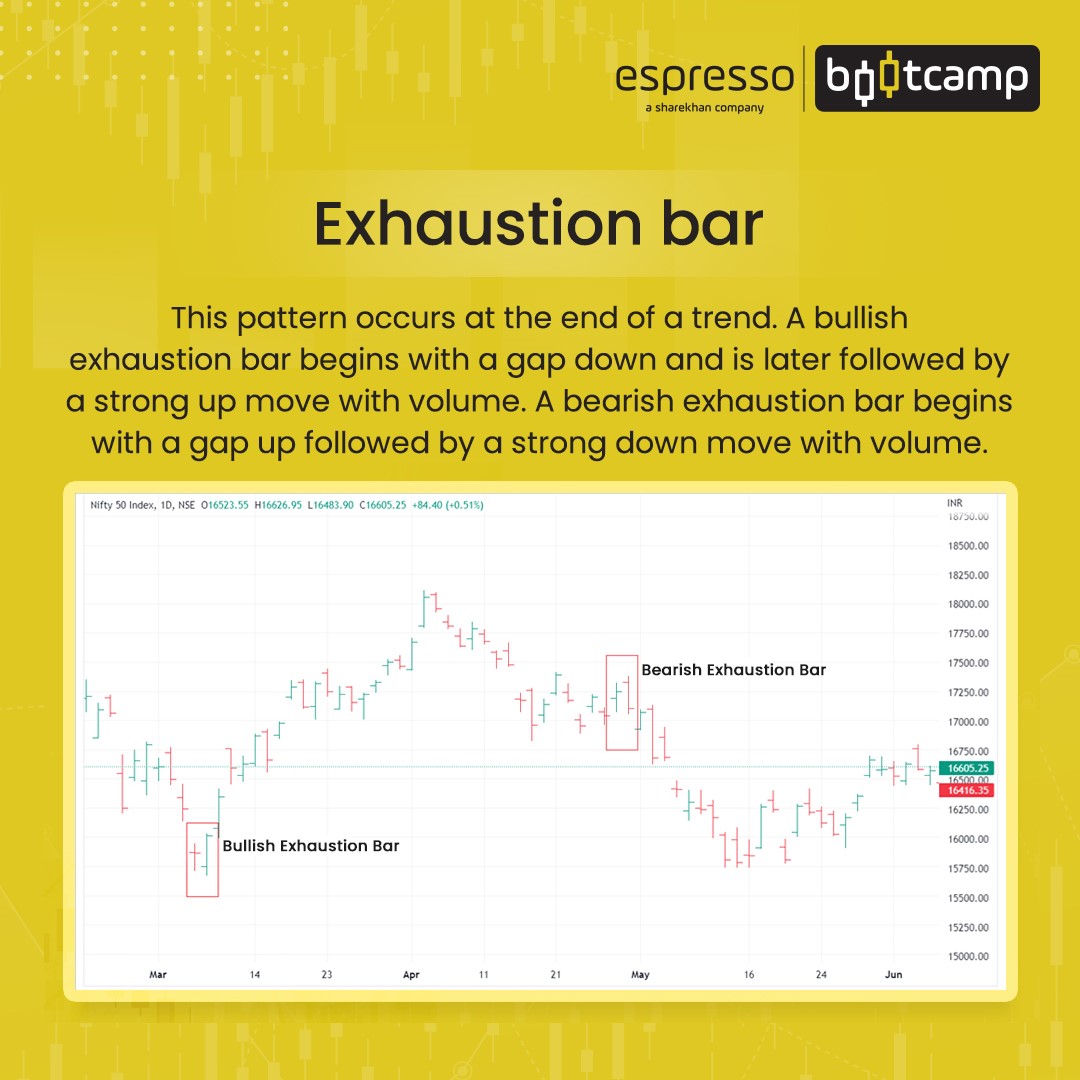
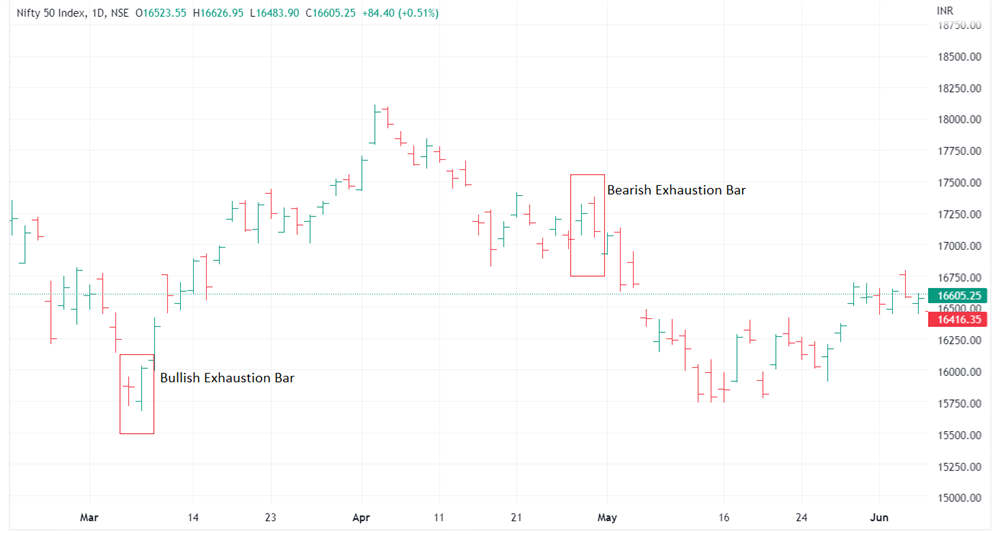
Exhaustion bar: This pattern occurs at the end of a trend. It can be either bullish or bearish. A bullish exhaustion bar begins with a gap down and is later followed by a strong up move with volume. The price closes near or at the high of the day. A bearish exhaustion bar begins with a gap up followed by a strong down move with volume. The closing happens at or near the low of the day. In both cases, the gap remains unfilled.
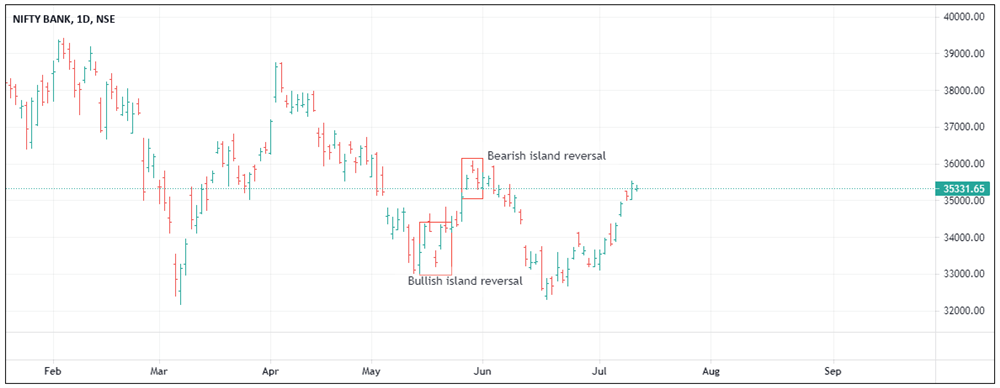
Island reversal: This can be bullish and bearish. The bullish island begins with a gap down after a downtrend, followed by a gap up of a bullish bar. Increased volume can be seen in both gaps. The bearish island begins with a gap up after an uptrend, followed by a gap down of a bearish bar. Volumes are generally higher in both the gap up and gap down candle. The island reversal is a rare pattern but is known to trap traders when they are long or short.
Points to remember:
- The length of the bar in a bar chart is indicative of the price range.
- Bars closing higher than the previous indicate an uptrend while the reverse is true for a downtrend.
- The gap between the closing prices can also help analysts to understand the buying or selling pressure.
- Bar chart patterns are more reliable in higher timeframes.
 0
|
0
|
 0
0

