
 Watch
Watch Now that we’ve learnt about fundamental analysis, let’s put our minds to the other major school of market analysis - technical analysis. This chapter will be your introduction to technical analysis and will tell you how it is different from fundamental analysis and what are the benefits of technical analysis over fundamental analysis.
What is Technical Analysis?
- Technical analysis is a technique often used by traders to look for trading opportunities by studying a stock’s price trends and chart patterns
- Technical analysis helps predict a stock’s future price behaviour based on trends and price chart patterns
- It is done using stock price charts, which are graphical representations of the price/volume of a stock over a given period of time
Technical Analysis vs Fundamental Analysis
Fundamental analysis involves number crunching. Therefore, a knowledge of accountancy and related subjects, though not mandatory, makes this exercise simpler.
Technical analysis, on the other hand, does not have any such prerequisites. All it needs is a passion for stocks and analysing them.
However, it should be noted that, in both cases, the market price is the basis for investing in stocks.
Benefits of technical analysis
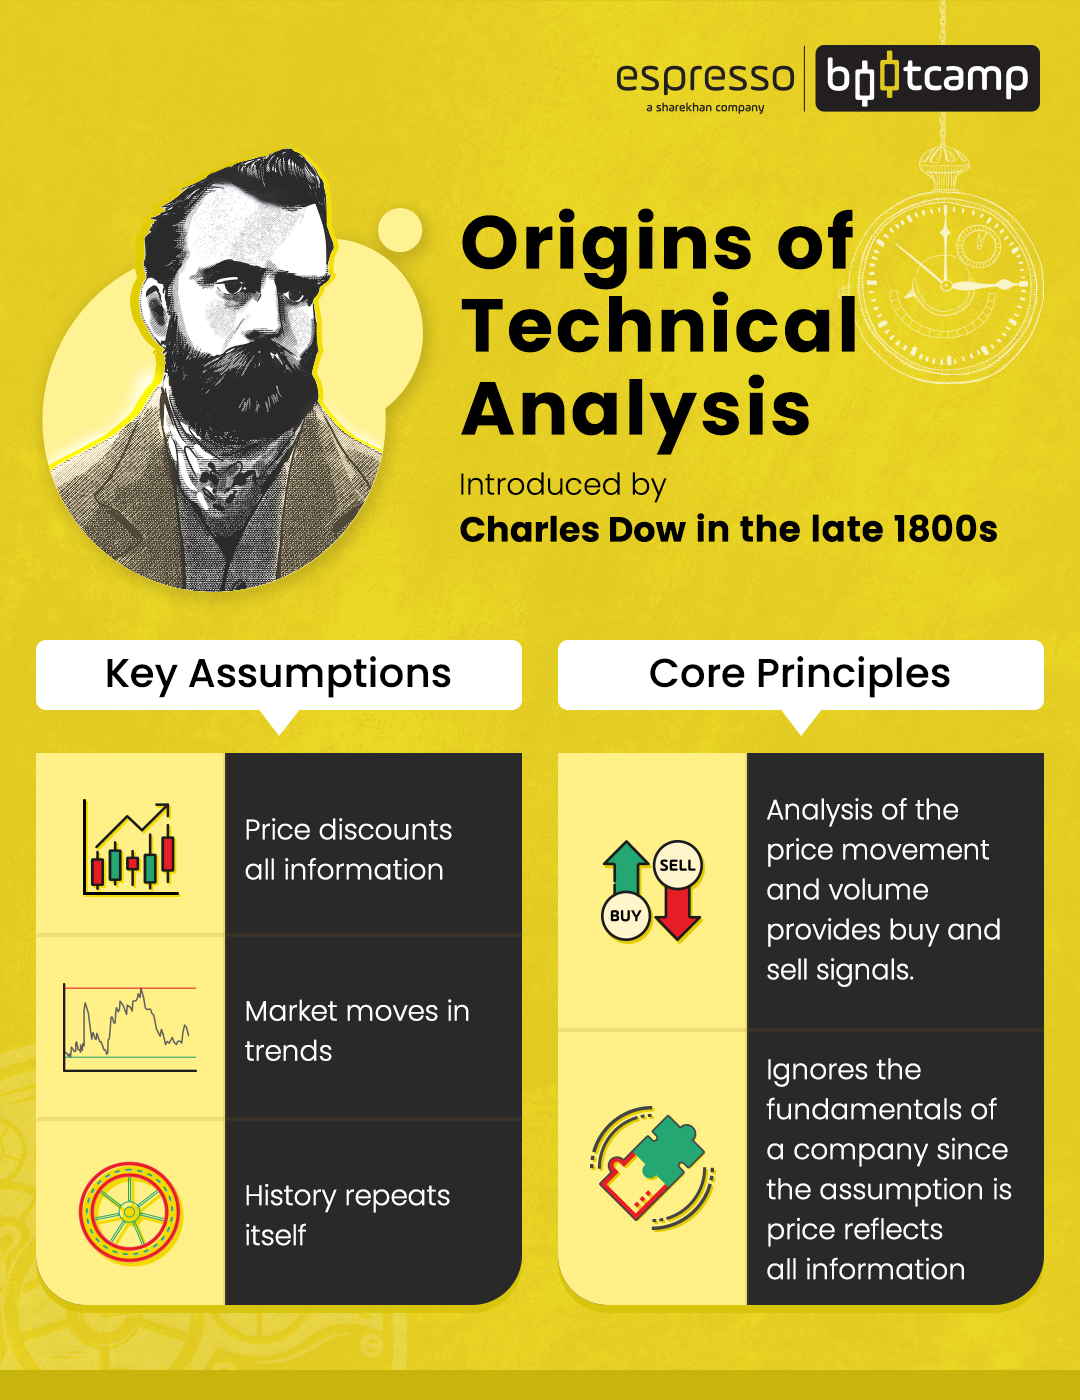 Technical analysis by definition is based on the assumption that the market discounts all factors, which is a time-tested hypothesis. The biggest advantage is it helps identify entry and exit points for stocks – a feature that makes it useful even for fundamental analysts. It is more accurate than fundamental analysis, where there are chances of certain factors being missed out.
Both short-term and long-term traders can use this as a weapon to maximise returns. In fact, in day trading, where entry and exit points are crucial, technical analysis tools can be effectively used to identify patterns and spot breakouts.
A big benefit of technical analysis is anyone can practice this method, irrespective of educational background. While fundamental analysis techniques and ratios might not come easy to everyone, in technical analysis, stock selections are made based on past price behaviour and chart patterns. Anyone willing to spend time studying these can master this technique.
Pitfalls of technical analysis
While adopting this technique, you must be mindful that while historical price patterns may throw some light on future price movements, there is no guarantee it will always happen.
In technical analysis, the available indicators might give different indications, thus confusing the analysts. This may often lead to heavy monetary losses or loss of opportunities.
In addition, technical analysis has no place in IPOs as there is no historical data on the stock, and one has to depend on fundamental analysis solely. The critics of this technique, therefore, rightly point out that technical analysis is not a universally applicable tool.
Sources of charts and price data
If we rewind to the days of trading rings, Bhav Copy was the only source of stock prices. A snapshot of the day’s market activity, traders used it to gather key data such as the Open, High, Low, Close, Volume and Last Traded Price for every scrip and contract.
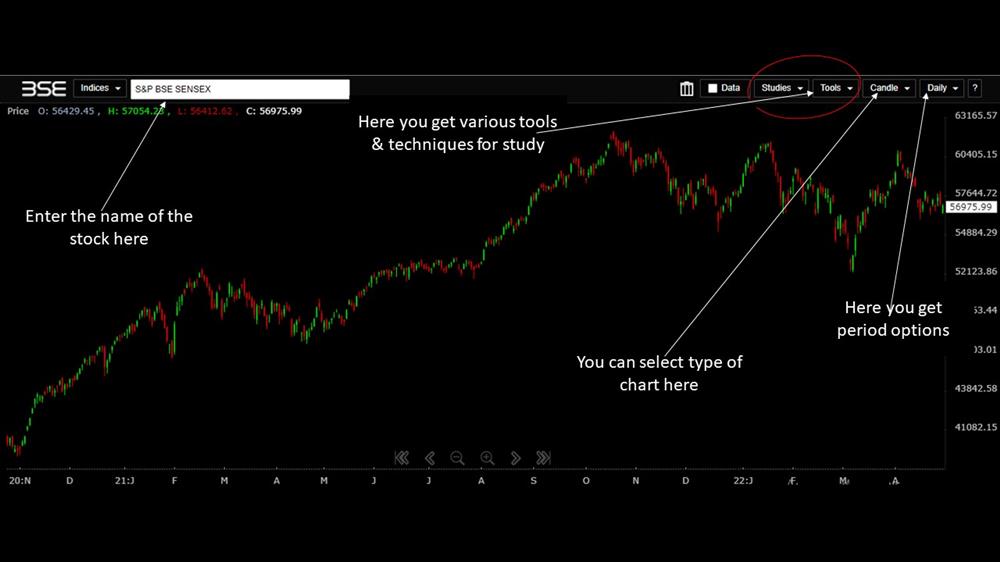
Online trading platforms, which have replaced conventional trading rings, have made our lives simpler by providing real-time price movements. In fact, you can plot the charts on your own after taking historical price data from the stock exchanges. Price charts (with various analytical tools) are available on the Bombay Stock Exchange (BSE) and National Stock Exchange (NSE) websites, which makes the task of technical analysis much easier.
For example, on the BSE website (www.bseindia.com), you can find the charts of indices as well as individual stocks. All you need to do is type in https://charting.bseindia.com/, and it will directly take you to the menu-driven charting page.
Also, most brokers provide charts on their websites for technical analysis. All you need to learn are various charting techniques before using them for trading and investment purposes. It’s always better and safer to initially do the trades on paper based on chart behaviour to gain knowledge and confidence before moving into actual trading.
Types of charts
.png)
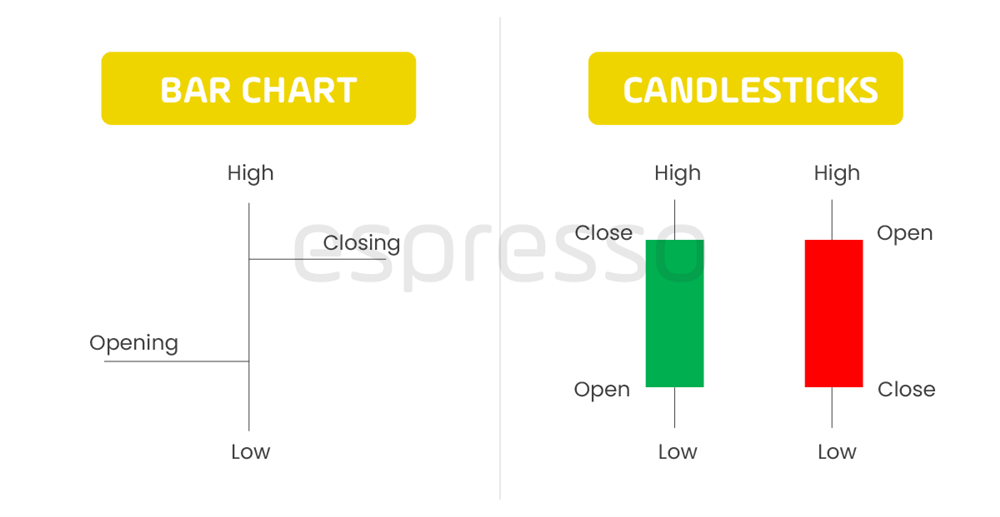
While there are various types of charts, the most popular are candlesticks, bar charts and line charts. While bar charts and candlestick charts have many similarities, line charts are slightly different.
- Candlestick and bar charts use opening, closing, day’s high and low prices, while line charts use only one of them, which is usually the closing price.
- Bar charts and candlesticks are more informative than line charts as they give a clearer picture of a stock’s price movement and volatility.
- Bar charts and candlesticks give almost the same information though they differ in presentation – lines are used in bar charts while rectangular blocks of red or green colour are used in candlestick charts.
Line charts
- Drawn by connecting the closing price of a stock on various days
- Usually give stock price or volume information on the vertical axis, i.e., the Y-axis and the corresponding time period on the horizontal or the X-axis
Bar charts
- A vertical line (instead of a dot) is used to indicate the high/low/open/close price of a stock.
- Two extremes of the vertical line are used to indicate the day’s high and low prices.
- A small horizontal line to the left indicates the day’s (or session’s) opening price, while the horizontal line to the right indicates the day’s closing price.
- When the small horizontal line to the left is at a higher level than the horizontal line to the right, it indicates the closing price of the stock is lower than its opening price.
- When the small horizontal line to the left is at a lower level than the horizontal line to the right, it indicates a higher closing price of the stock price (than the opening price).
Candlesticks
- Red candlestick indicates the closing price is less than the opening price.
- Green candlestick indicates the closing price is more than the opening price of the session.
- Longer wick at the top indicates the stock price closed much lower than the day’s high.
- Longer wick at the bottom indicates recovery of the stock price from the day’s low.
- If there is no wick or a very short wick at the top, it indicates the stock price closed at the highest price of the day or near the day’s high.
- If there is no wick or very short wick at the bottom of the red candle, it indicates the stock price closed at the day’s low or closed very near to day’s low.
- Green candle with no wick at the bottom indicates that the stock price never moved below the day’s opening price during the whole session.
Points to remember
- Technical advancement (in the form of online trading) and the advent of the internet have contributed to the growth of technical analysis in recent times.
- Real-time availability of quotes and facilities used for technical analysis has further contributed to the popularity of stock analysis.
- It is critical to do your homework before jumping into trading with the use of technical analysis, as historical price patterns do not come with guarantees.
- Be mindful of the indicators and study them properly before making a decision.
 0
|
0
|
 0
0

