
 Watch
Watch As we have seen in our chapter on charts and chart types, candlestick patterns are among the most popular charts used by technical traders.
The reason: Candlestick charts give very reliable signals for initiating a trade on an individual candle and a group of candles.

What do candlestick charts show
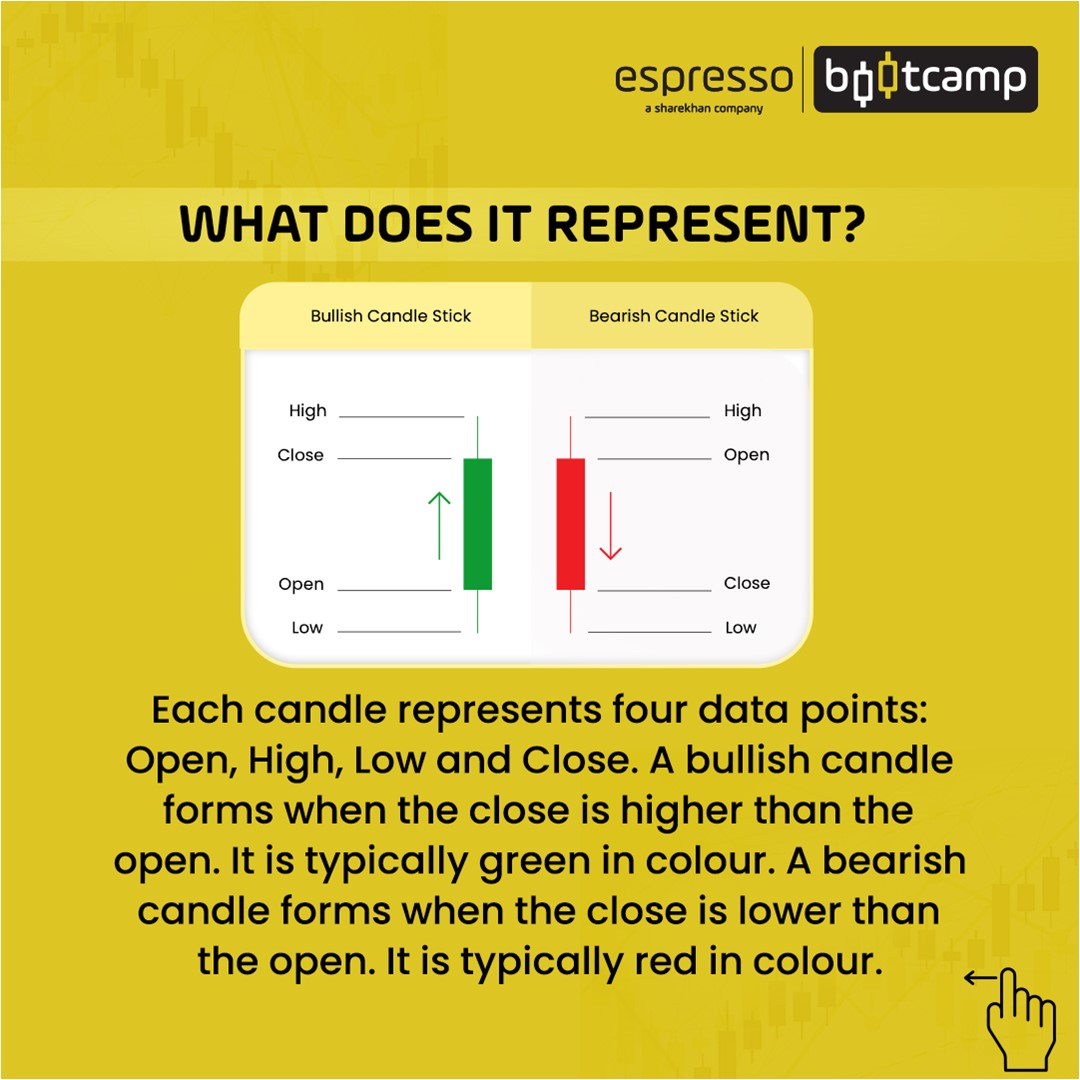
- Open, high, low and close (OHLC) data
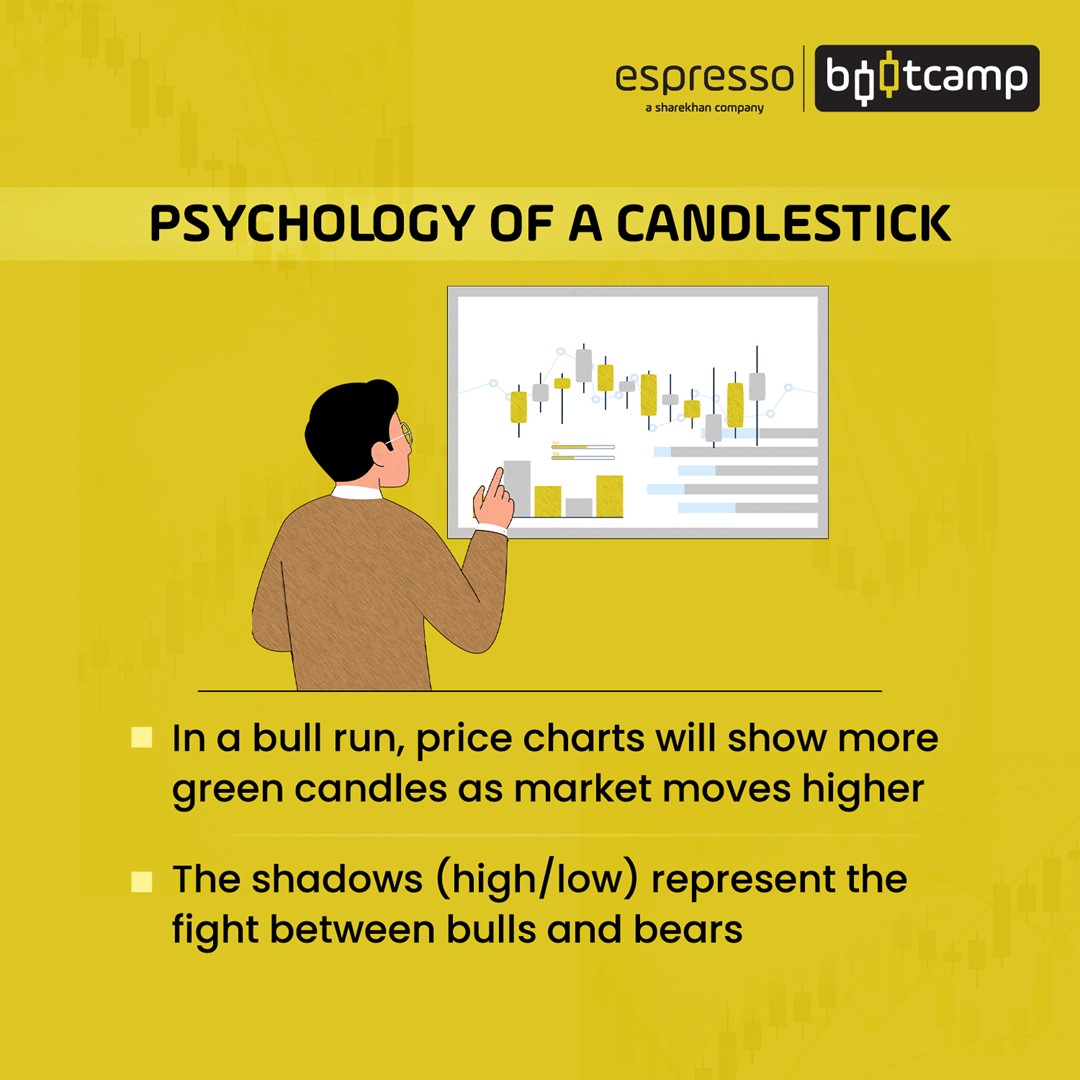
- A trading day’s price action through colour and size
- Before the advent of technical software, candlesticks were black and white
- A hollow white candle and a black candle were used to understand the price action of the day
- Today, a bullish candle is easily identified with a green or a blue colour
- A red candle indicates a bearish candle
- Thin lines above and below the candle body are known as shadows or wicks, indicating price extremes
Candle and its body language
Body: A candle with a long body conveys the strength of the price movement during the timeframe of the candle. A shorter body conveys the price has not moved much during the period of the candle.
Wick: A candle with a long body and a short or no wick indicates strong price action. A long green candle devoid of a wick or with a short wick indicates bullish price action.
A long red candle with a small wick or devoid of it indicates bearish price action for the period of the candle. If a candle is devoid of the upper wick, it is known as a shaven head, and if devoid of a lower wick, it is known as a shaven bottom.
Proportion: A candle with a long wick and a short body near the high indicates bulls taking charge. On the other hand, a candle with a long wick and a small body near the low indicates the bears are in control. A small body with wicks on both sides indicates a volatile session.
The Japanese interpretation
In a candlestick pattern, emphasis is laid on the open and close than on the extremes, as these two points are considered the most emotionally charged. Japanese traders use military analogies to describe the nature of a candle.
As we know, the first hour of the opening session provides the direction for the rest of the day. Japanese traders believe overnight rumours and news play out in the opening session and call this ‘the morning attack’. Anxious traders with overnight positions have to deal with the news and rumours and scramble to cover, close or hedge their positions.
Similarly, the close is also important as margin calls on derivative positions are based on closing prices. Heavy transactions can happen in this closing session. The Japanese call this ‘the night attack’.
Conveyors of emotions
If technical analysis can help understand market emotions, candlesticks are the enablers. According to the Japanese, the colour and names of candlesticks depict the emotions of the market truly well.
- Hanging man candlestick denotes a negative emotion.
- Morning star candlestick denotes a fresh beginning after a sell-off.
- Evening star candlestick means prices are entering a dark phase.
- Marubozu candle, the Japanese word for a shaven head, suggests strong stock movement in a particular direction.
- Doji, meaning error or mistake, implies the close and open are almost the same and indicates an indecisive mood. We will discuss more on the varieties of Doji as we progress.
Types of candlestick patterns
There are two types of candlestick patterns:
Reversal pattern
- They can be single-candle or multi-candle.
- Hanging man, hammer, spinning tops, Doji, morning stars and evening stars, Marubozu etc are single-candle reversal patterns.
- Engulfing, piercing, dark cloud, etc., are multi-candle reversal patterns.
Continuation pattern
- It is always multi-candle.
- Three white soldiers, Three black crows, Tweezers, etc., are examples of this pattern.
More on candlestick patterns in the upcoming chapters.
Points to remember
- While candlestick charts are popular, they need to be studied minutely to get a complete understanding of
- A comprehensive understanding of the body of a candle, types of candlestick charts and their patterns is an interesting exercise, and if done right, will boost your technical analysis abilities.
 0
|
0
|
 0
0

