
 Watch
Watch 
The most ignored information on market volume is the most useful information for trading with an edge. The volume provides support, confirmation or confidence, whatever you may call it, to the direction of the trade. It is probably the undercurrent of a price move. Volume in financial markets is defined as the number of times an asset has been traded over time. Now, let's look at what is volume-based trading in technical analysis. Volume-based trading includes analysing and using the raw volume data to execute a trade. You can conduct volume trading by using volume data or volume-based indicators.
Reading volume
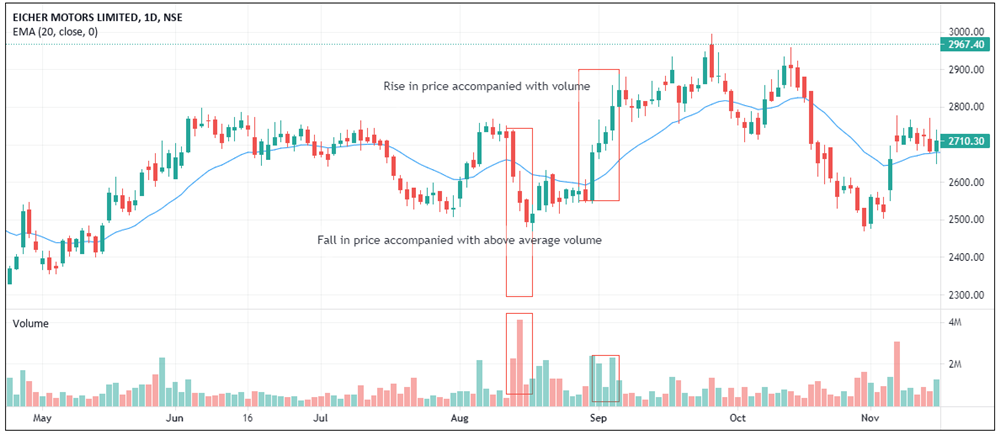
Reading volume is as important as price action as it gives an extra impetus to the trader. An increased volume of sharp price movements accompanied by volume can be an indicator of a continued move in the same direction. This means it confirms the price trend. An increase in price supported by an increase in volume means an uptrend. However, a decrease in price with an increase in volume indicates a downtrend. Broad market sentiments are also confirmed by volume. An uptrend with an increase in volume followed by a pullback with lesser volume confirms a bullish trend. Likewise, a downtrend with an increase in volume and a pullback with lesser volume confirms a bearish trend. Trend breakouts and breakdowns with incremental volume confirm the breakouts and breakdowns.
Indicator-based volume trading
On-balance volume (OBV) indicator
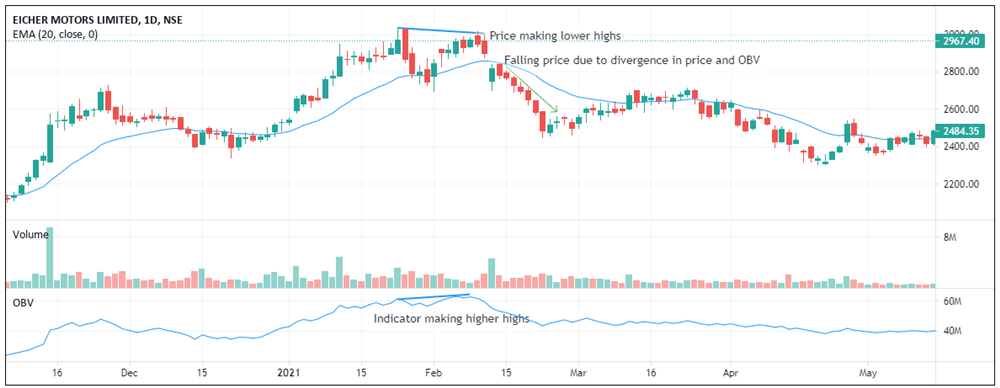
Not many will be keen to look at the raw volume indicator to trade due to possible natural bias towards the price. Many indicators are available in the technical analysis package that has readymade indicators on volume, one of which is the on-balance volume (OBV) indicator. The OBV indicator was created by Joseph Granville in 1963. In his book titled “Granville’s New Key to Stock Market Profits,” he proposed that volume was the main force behind major market moves. He was of the view that volume preceded price. OBV is nothing but a running total of volume where, when the price is above the previous price, it is positive, and volume is added to the cumulative volume. Conversely, when the price is less than the previous close, it is deducted from the cumulative volume.
OBV is used as a divergence indicator, unlike an oscillator that measures the over-bought or over-sold range of price. OBV is believed to measure institutional activity versus retail activity when the divergence is observed. For example, if the price makes a new high, OBV also should follow and make a new high. However, if the price makes a lower high, that means there is a bearish divergence that points to retail interest rather than institutional interest. Similarly, if the price makes a lower low while OBV makes a higher low, that means there is a bullish divergence, and the price has fallen with lower volumes.
There can be divergence when the OBV makes lower lows and the price makes higher lows, indicating institutions are accumulating. Alternatively, if OBV makes higher highs, but the price fails to make higher highs, it means institutions are shorting the market.
Accumulation and distribution line (ADL)
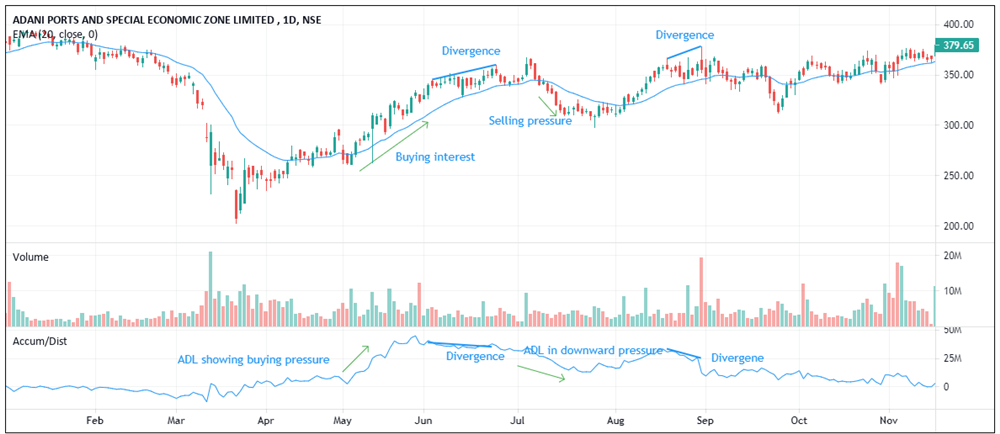
ADL is an indicator developed by Marc Chaikin. This indicator measures cumulative money flow into and out of an asset. A money flow multiplier is calculated by using the closing price with the price range (high-low). The multiplier fluctuates between +1 and -1. It is positive if the price closes in the upper half of the price bar and negative if it closes in the lower half of the price bar. The product of the multiplier and the volume are used to arrive at the money flow volume. The money flow volume is added to the previous money flow volume to arrive at the ADL. This is also a cumulative volume indicator.
In simple terms, this indicator uses price and volume data to measure the accumulation or distribution happening in security. A higher positive multiplier and a high volume will indicate a strong buying interest. Conversely, a lower negative multiplier and a lower volume will indicate selling pressure. The chart below shows how ADL shows upward and downward pressure.
ADL also indicates divergences. An increase or uptrend in prices and a decrease in ADL indicate a possible reversal, and prices may move down shortly. Similarly, a decrease in prices and an increase in ADL indicate positive divergence, and prices can go up. In the below chart, two divergences are spotted, after which the price goes down.
The money flow index (MFI)
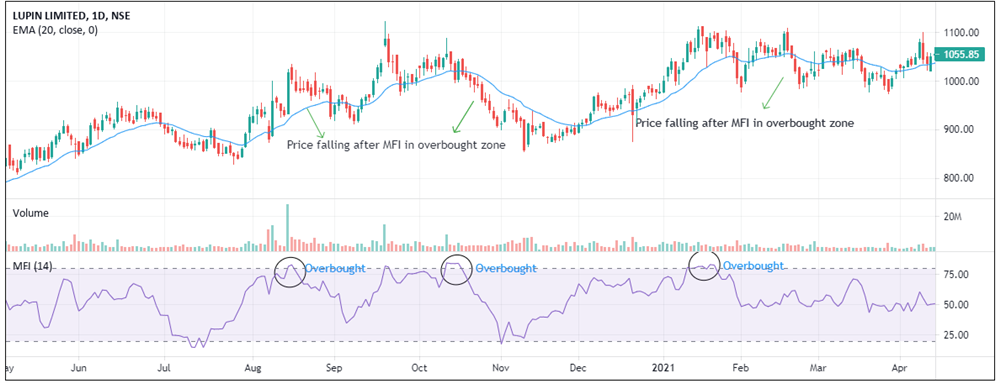
MFI, developed by Gene Quong and Avrum Soudack, is a volume indicator that oscillates between 0 and 100. It uses the logic of the relative strength index (RSI). Since it uses price and volume, it is also known as volume-weighted RSI. This volume-based indicator shows the over-bought and over-sold zones. In MFI, a typical price which is an average of high, low and close, is calculated and then multiplied by volume to arrive at money flow. Money flow can be positive or negative. Positive money flow is calculated by adding all the money flow whose typical price is greater than the previous typical price. Similarly, negative money flow is calculated by adding the money flow whose price is less than the previous typical price. A ratio of positive to negative money flow is calculated, known as the money ratio. After this, an index is created. This MFI is then plotted as an RSI that oscillates between 0 to 100, where a value of 80 is in the overbought zone and a value of 20 is in the oversold zone. Like RSI, positive and negative divergences are given.
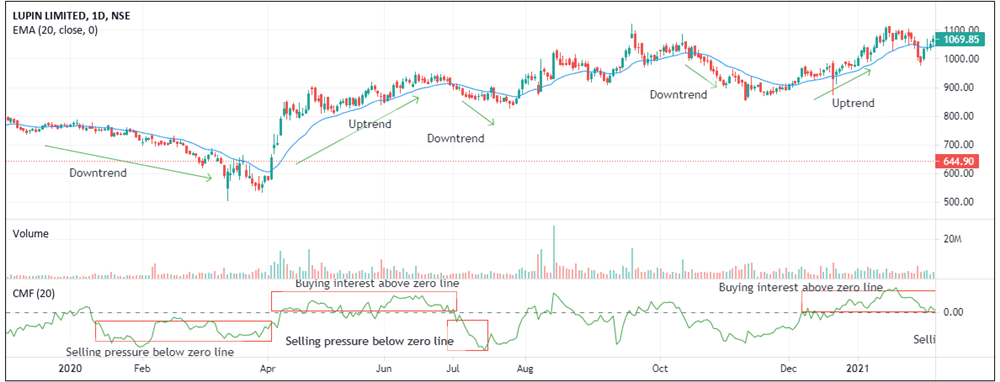
Chaikin's money flow indicator (CMF)
CMF is similar to the ADL developed by Marc Chaikin. However, it is also slightly different. Unlike ADL, which is cumulative, CMF is not cumulative. CMF is a result of the summation of money flow volume for a look-back period of 20 or 21 days and division by volume for the same period. CMF oscillates between -1 and +1, but it doesn’t reach those extremes and oscillates in the range of -05.50 +0.50 with 0 as a centre line. A move above zero indicates buying interest and below zero indicates selling pressure. Divergences are possible.
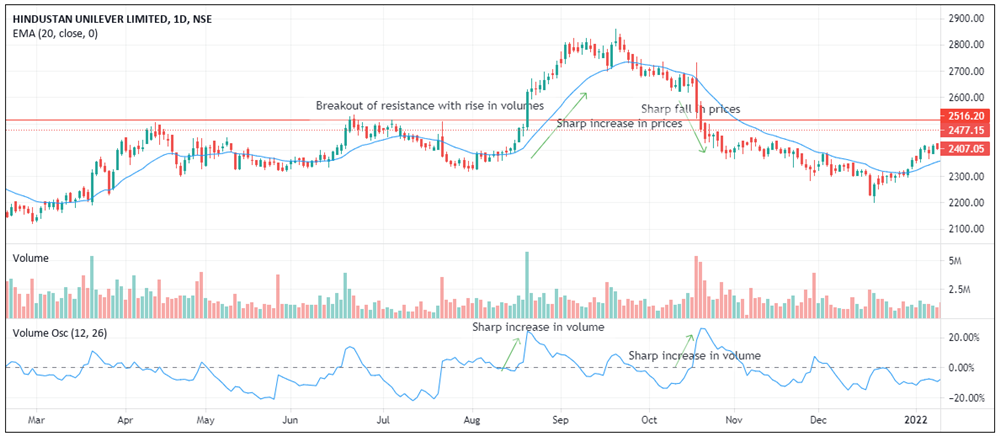
Volume Oscillator (VO)
VO is an indicator like the MACD but is calculated on volume instead of price. Typically, VO uses a 5-period and 10-period slow and fast EMA. The difference between both the EMAs, expressed as a percentage of the slow EMA, is plotted as an oscillator. VO works well in case of breakouts and breakdowns, as the price will be accompanied by volume. It is used to identify expanding or contracting volume. As VO oscillates above and below zero levels, a VO above zero will indicate above-average volumes. It indicates below-average volumes when the VO is below zero lines. VO movements are independent of price movements. However, movements in prices and VO have to be correlated. For example, an increase in VO must be correlated with an increase or decrease in price for a strong uptrend or a strong downtrend, respectively.
Conclusion
The trading volume forms an important part of the analysis for trading. However, many traders use only price action to initiate trades. Also, most traders are not adept at interpreting raw volume data. For them, volume-based indicators are a useful tool for trading. However, one must corroborate volume indicators with price action to confirm a possible trade, as many volume indicators do lag behind.
 0
|
0
|
 0
0

