
 Watch
Watch Scalping is a very short-term day trading method lasting for merely a few minutes. A scalper may trade in any security several times in a day to earn small profits from small price changes. Since it involves taking advantage of minor fluctuations in price, the trading volume is higher, intending to have better absolute profit. Scalpers use high probability set-ups to trade as the error margin is very narrow and the risk is very high. Scalping strategy requires stable volatility, as high volatility can hit the trader’s profit and loss account quite badly.

Requirements of scalping strategies
Scalping is a high-volume and multiple-entry exit strategy that needs speed. Therefore, a good trading platform is a key essential. As the transactions are heavy, a brokerage account with low transaction costs is a must. A computer system with a good internet speed cannot be undermined. An advanced charting tool is indispensable. One cannot do scalping without looking at the prices running on the charts. Next in line is strict risk management and money management. Having a rule-based approach and strict stop losses will add a day to the traders' trading life. Last but not least, a mindset that can accept small profits and losses and the fortitude to put hours day-in and day-out sitting behind the screen looking for opportunities are the traits that cut out a scalper from the rest.
Popular scalping strategies
In this section, you will also about the advantages of scalping strategies and the risks of scalping strategies along with some of the common scalping strategies used by traders. As we have understood, scalping strategies can be based on price action or indicators. Price action-based scalping strategies use price patterns, support resistance or candlestick patterns to identify and execute trading.
A basic price action scalping strategy can begin by identifying support and resistance- recent swing highs and lows. Recent data is more significant than past data in scalping. Apart from this, candlestick patterns that can indicate reversals and pullback help take a scalping trade. Trading against the trend can be risky. It is always better to trade with the trend. If the larger trend is down, it is advisable to go short on pullbacks, and if the larger trend is long, it is better to go long on pullbacks.
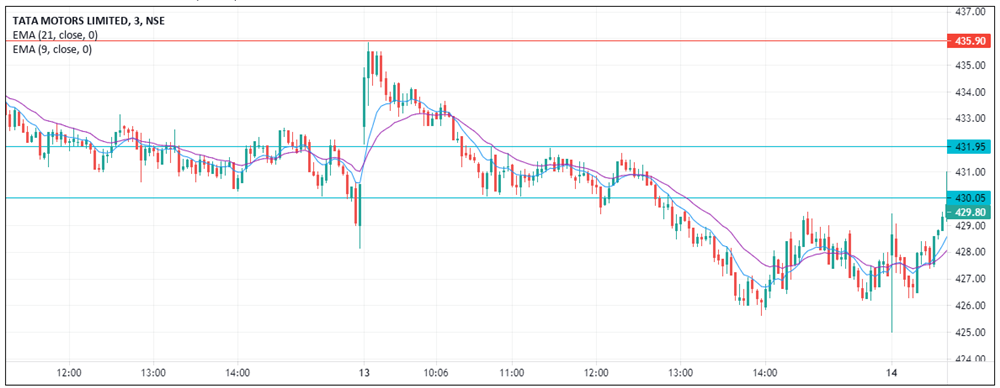
In the chart below of Tata Motors, the horizontal line above is a gap resistance made when prices opened gap down on the 12th of July, 2022. The overall trend for tata motors has a downward bias. On the 13th of July, 2022, prices opened positive and failed to breach the horizontal gap resistance. A short at the closing of the second candle with a couple of points above the high of the second candle a short trade is a good scalping trade in the three-minute time frame. The third candle is a bearish Marubozu. The trade comes in favour as the price slides down. A quick profit can be booked based on a risk-reward ratio of 1:3 or as per the risk appetite of the trader. A Scalping trader usually waits for the risk or reward to be hit and doesn’t force an exit in between.
In the same example, the prices consolidated, forming support as seen by the support line drawn. However, the upside was being rejected by candles making higher upper wicks and smaller bodies. A couple of shooting stars also emerged, indicating weakness. A short opportunity with a stop loss with a few points above the resistance line is seen. The price broke the support line indicating it would slide however, it recovered and pulled back. The price did pull back close to the second swing high but faltered. Finally, the price broke the support to slide down sharply. Scalping needs patience and is a highly intense trading method. One needs to work on the emotional part regularly to accept the outcomes.
Scalping with indicators
It is difficult to trade price action at lower time frames as price moves can be fast and sharp. Also, not many can identify the support and resistance areas easily, nor can they identify candlestick patterns. Nevertheless, one can scalp trade with indicators. We will examine a few popular indicators used by traders to scalp trade.
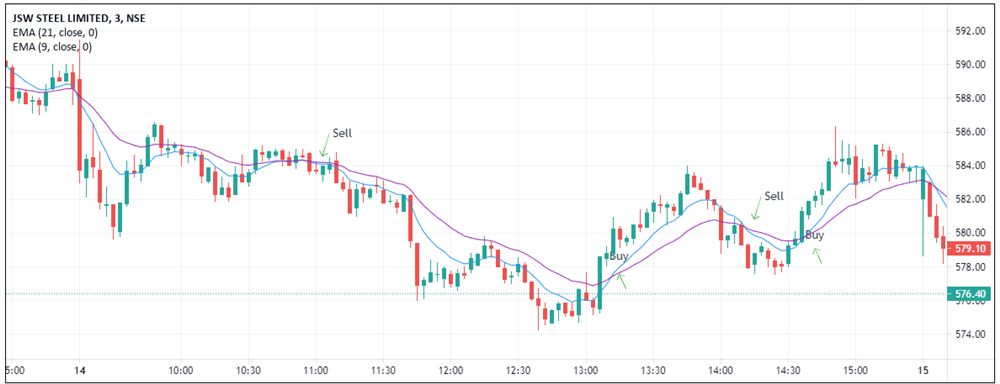
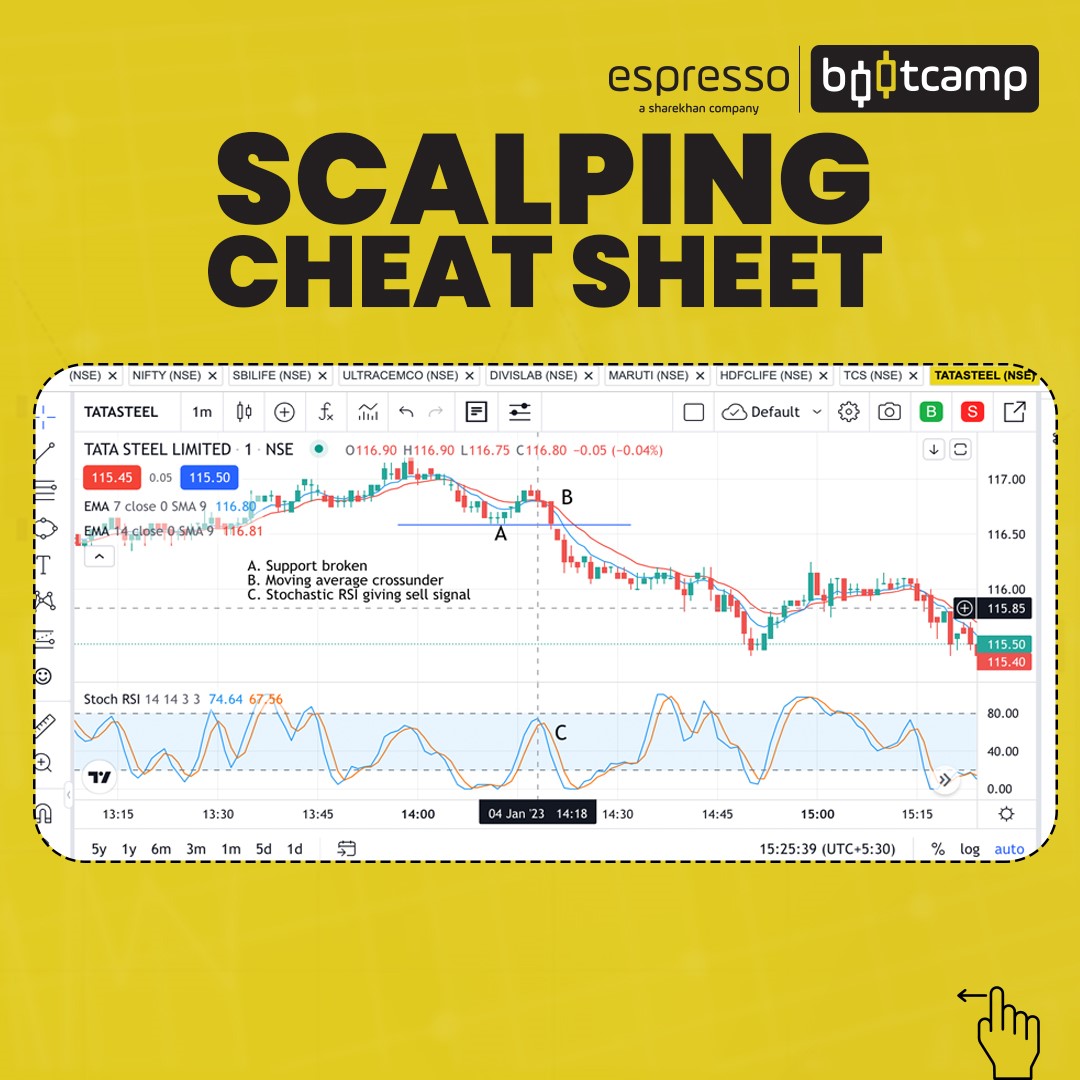
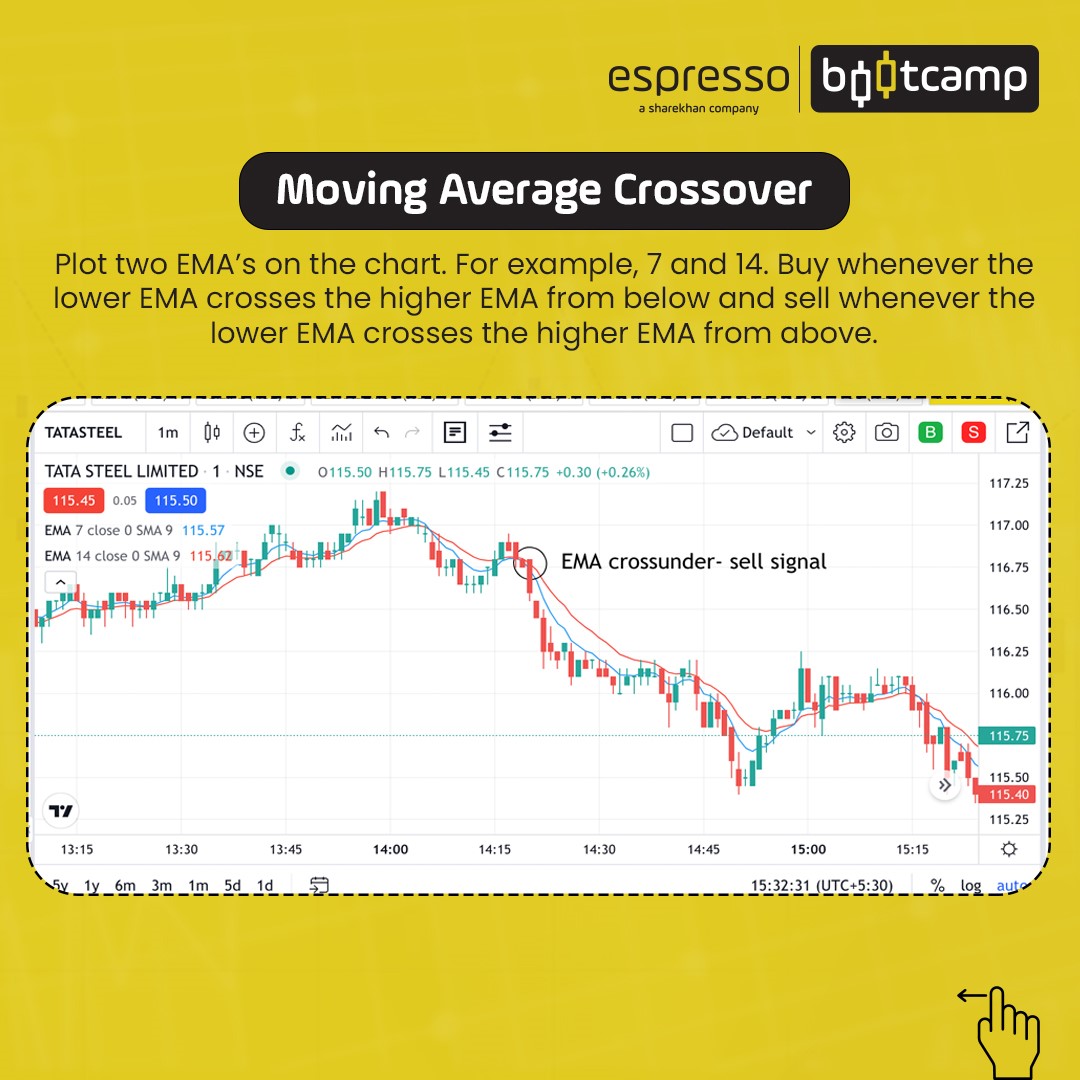
Moving average crossover - One of the popular strategies across time frames moving average crossover uses two exponential moving averages (EMA) like a 5-20 EMA or 7-14, 9-21 EMA etc., to trade. It is a simple strategy where the lower EMA crosses the higher EMA to indicate a bullish or bearish move. If the lower EMA crosses above the higher EMA, it’s a bullish view, and if it crosses below, it’s a bearish view. In the chart below, the opening crossover on the 14th of July is avoided. The other crossovers are valid. It is better to avoid the last 30-40 minutes for any trading activity. Entry and exit, including stop loss, can be on crossovers of the moving averages.
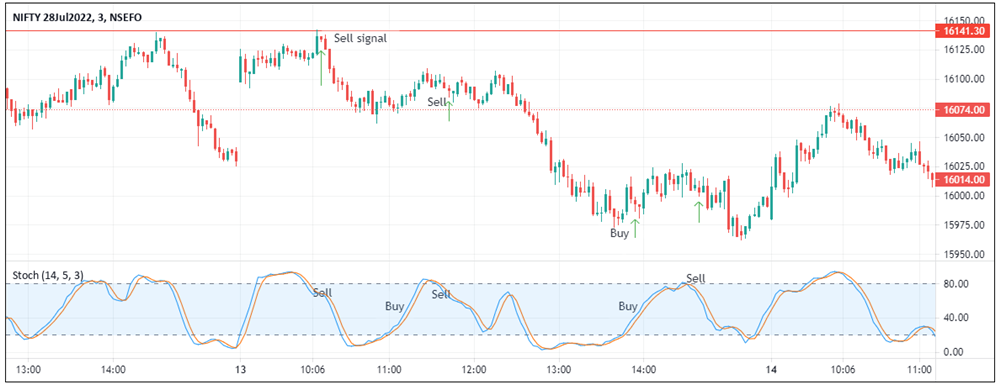
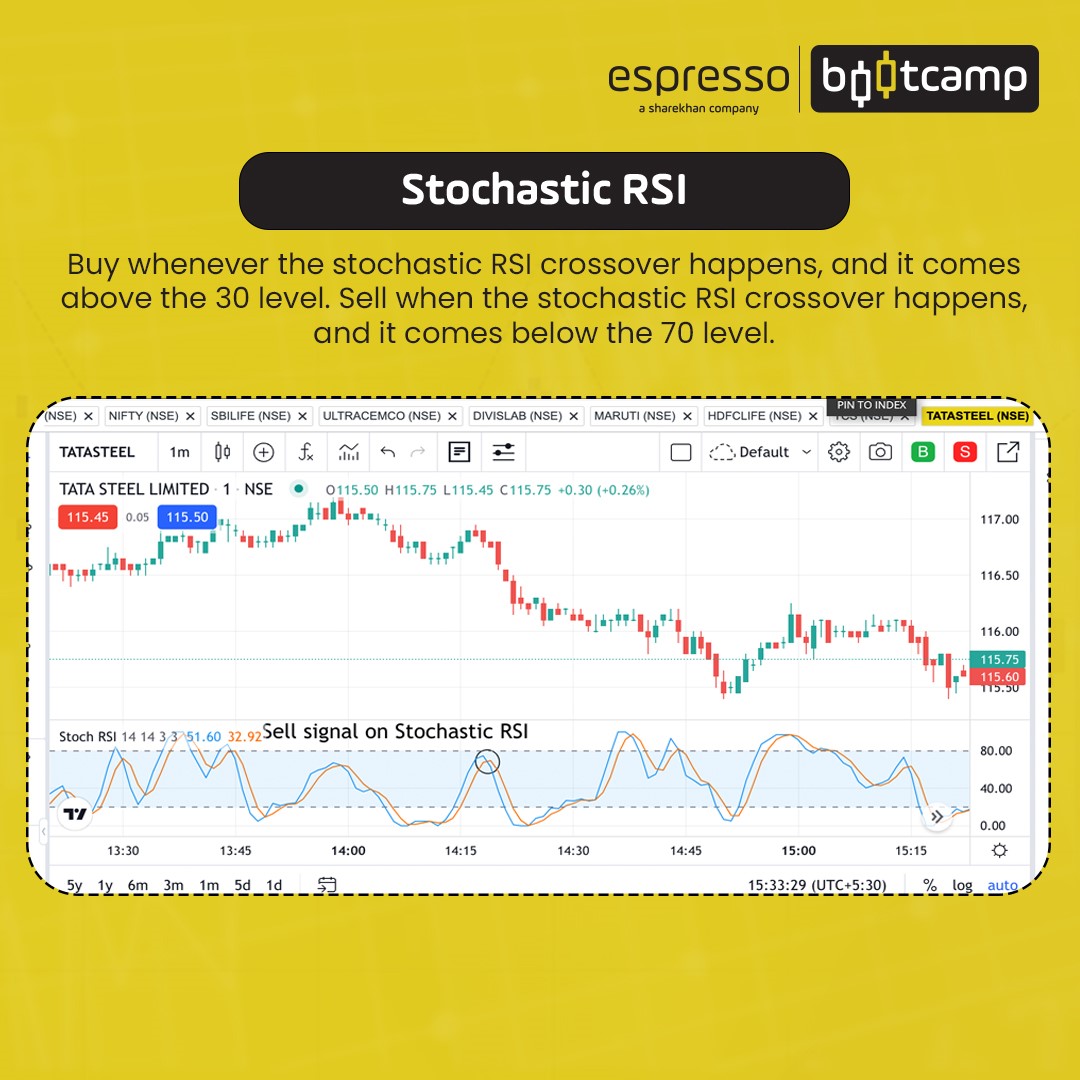
Stochastics - This indicator indicates the trading range of a security over a period expressed in percentage. It is an oscillator that swings between 0 and 100, indicating overbought and oversold zones. A line known as the %K compares the closing price with the highest and lowest price during the specified period. This line is smoothened by a %D using a 3-period SMA. The crossover of lines and divergences is traded. In our examples, we shall be using full stochastic with default values 14,5,3. An ideal entry would be when %K and %D move below 70 and above 30 for a long or a short trade, respectively. In the chart below, on the 13th of July, 2022, the Nifty opened the gap. However, the stochastic came into the overbought zone later. There was immediate previous swing resistance that was tested. The crossover of stochastic happened at overbought earlier, but the %K & %D moved below 70 later and therefore, the trade was taken later.
Bollinger bands are bands that are plotted upper side and the lower side of a 20-period simple moving average line. These bands are 2 standard deviations away from the average line. That means 95 per cent of the data of the said 20-period are covered in 2 standard deviations. 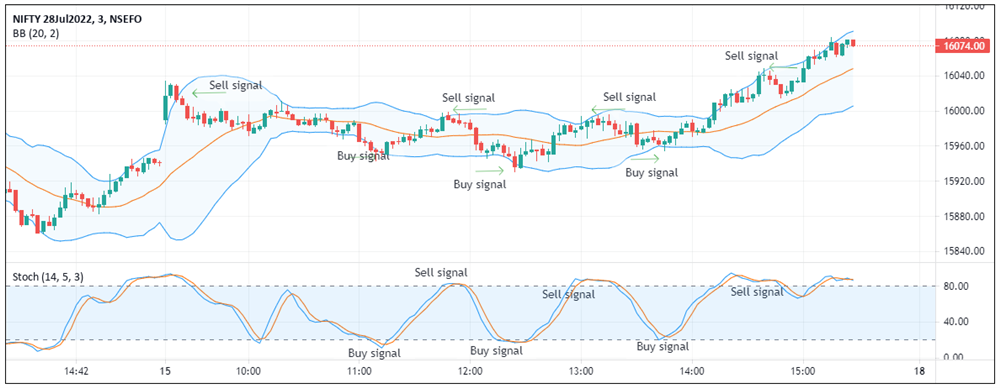 Prices going to either of the extremes may mean a revert, and therefore, a reversal strategy is in place for scalping. However, a plain mean reversal strategy can be risky as in trending markets, prices may go higher or lower along with the bands. Hence, we will add a stochastic oscillator as a signal indicator for buy or sell. A buy signal will be generated if prices close above the lower band and the stochastic has a positive crossover. Similarly, a sell signal will be generated if the price closes below the upper band and the stochastic has a negative crossover. Stochastics should also be in the oversold and overbought zone for a buy and sell signal, respectively. A clear crossover is recommended where both the lines are separate after the crossover.
Conclusion
Scalping is a high-intensity strategy as the stakes are high. Scalping involves large volumes and small profits. Therefore, the error margin is very less. A trader has to be doubly sure if he takes a scalping trade. Costs will add up as scalping is a high volume and multiple trade strategy. Losses will pile up if not traded with a plan that has a well-defined entry, exit and stop-loss. If the trader doesn't have a proper strategy that is back-tested will not only make losses but will end up burning his capital. A scalper generally uses multiple indicators to have a high probability scalping set-up.
 0
|
0
|
 0
0

