
 Watch
Watch Let's begin by answering what is swing trading in technical analysis. Swing trading is a short-term trading technique employed by traders to make profits from a change in price trends. The trade can last for a few days to a few weeks. A variety of indicators ranging from price action, indicators, candle stick patterns, Fibonacci and price patterns are used by the traders to execute a swing trade.

There is not much difference between swing trading and day trading except for the time frames they are traded in. A swing is explained as an upward or a downward pivot or peak that either acts as a support or resistance from where the trend is most likely to change. A swing trader is usually on the lookout for trends, patterns, pullbacks and high-volume stocks for trading opportunities. Swing trading needs a lot of homework to be done.
Types of swing trading
Swing trading can take many forms. But primarily, it's based on breakouts using support and resistance, moving average, trend lines, other continuation or breakdown patterns and retracements.
Breakout and pullback
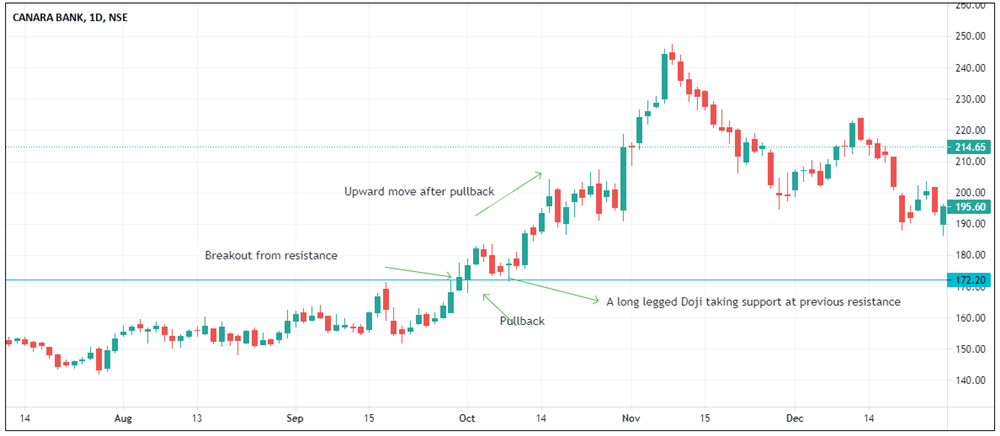
As prices move in waves, it makes upward and downward peaks that become swing support and swing resistance. In an uptrend, if a price breaks out of a previous higher peak, the trend is most likely to continue. A swing trade can be initiated when the price pullbacks. This is because a breakout can be often false, and confirmation is needed to ensure the trade is profitable. In the chart below, a breakout happens after a long consolidation. The resistance is broken, and a pullback will ensure trade is in place. A pullback happens with a long-legged Doji confirming an uptrend. A buy above the Doji with the low of the Doji as a stop loss can be a good swing trade.
Moving average
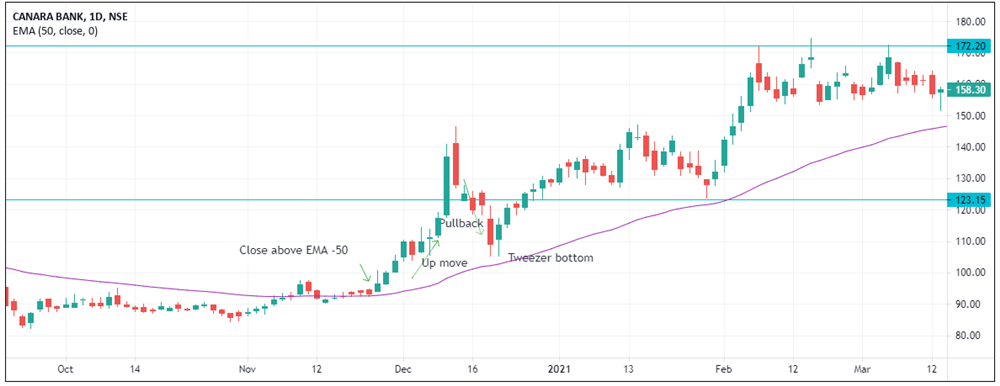
In this swing strategy, a price closing above the moving average is a probable buy trade. One can either take a trade after the price closes above the moving average and keep a stop loss below the moving average or wait for a pullback. Once a pullback happens, trade is in place. In the chart below, the price closes above the 50-period exponential moving average (EMA). One can buy above the candle or bar that has closed above the EMA with a stop loss below the ema or await a pullback. A pullback happens shortly as the price moves near the moving average. A tweezer bottom confirms an upward move.
Convergence of indicators
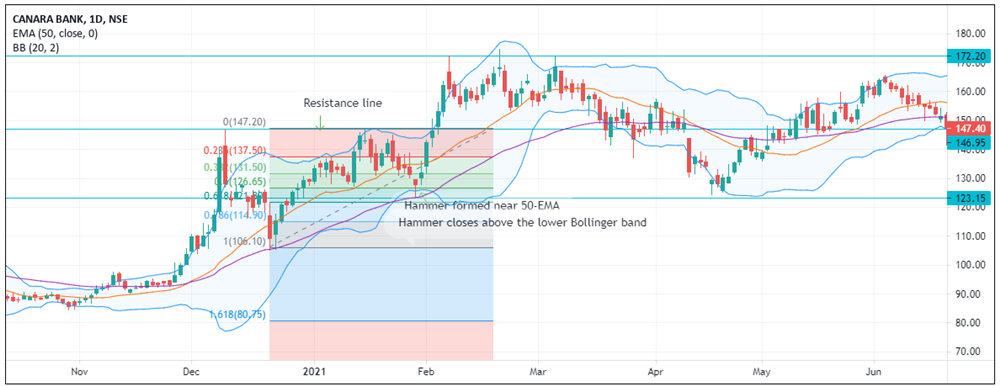
A convergence of indicators is one where many of the indicators meet to confirm an imminent price move. A moving average, a candlestick pattern or a trend line can all converge to point to a possibility of a move. In the below example, a resistance of the previous swing high is respected, and the price moves down towards the moving average. A hammer candlestick is formed, confirming the sellers have exhausted and the buyers are taking over. A Fibonacci retracement line is drawn from the previous swing bottom to the previous swing top, where the resistance indicates a 61.8 per cent retracement. The low of the hammer coincides with the 61.8 per cent retracement indicating that an upward move is sure to happen. The hammer also closes above the lower band of the Bollinger band. Expectedly the price moves up.
Price patterns
Some price patterns take time to form on the price charts, like the head & shoulder, the inverse head & shoulder or the cup and handle pattern etc. But whenever they form, they do give a good swing trading opportunity.
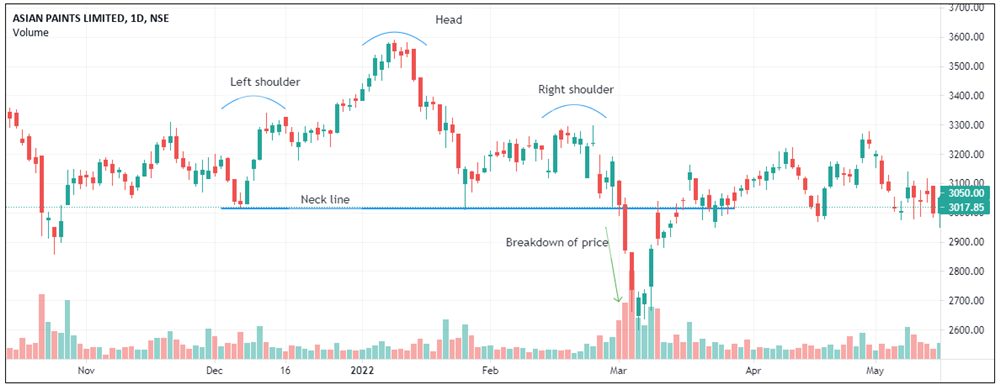
Head & shoulder this pattern is similar to a human head and shoulders. It is a bearish pattern which forms at the top of an uptrend. A break below the neckline indicates a downward move. In the chart below, a head and shoulder pattern is formed. At the end of the right shoulder, a green candle takes support at the neckline. But the subsequent candle opens much below the close of the green candle but fails to close below the neckline. However, a volume spike indicates the pressure. The next day the price opens almost at the close of the previous red candle indicating the sellers are going to continue with their selling. Aggressive traders may take an entry on the red candle that took support at the neckline on close. The conservative ones might take it the next day morning.
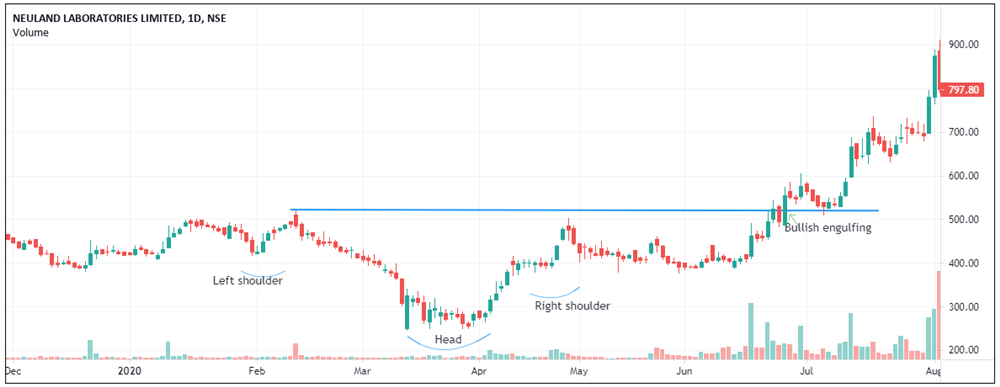
Inverse head & shoulder is the opposite of the head & shoulder pattern. It is a bullish pattern that forms at the end of a downtrend. A break above the neckline can lead to an upward movement. In the chart below, the neckline is broken after prolonged consolidation. An aggressive trader can take an entry at the first candle that touches the neckline. A more conservative trader can take a trade after confirmation. Confirmation occurs when the red candle near the neckline is engulfed by a bullish green candle (bullish engulfing).
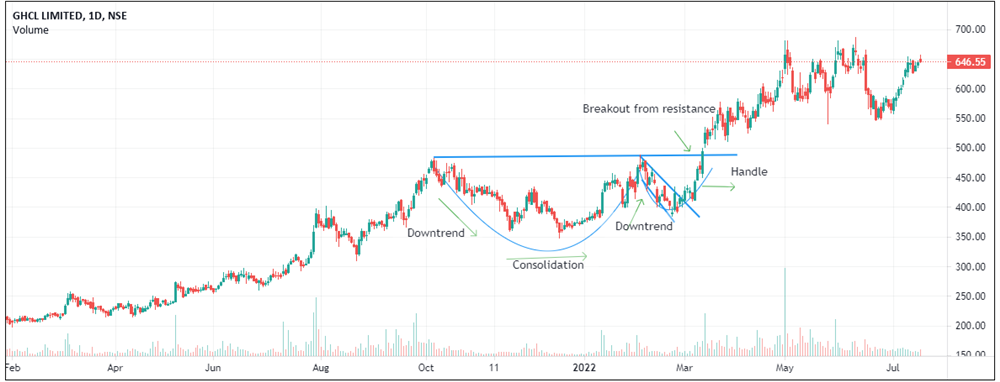
Cup & handle is a pattern that resembles a coffee cup with a handle to hold it. This pattern is bullish. After a long falling trend, the prices consolidate at the bottom and make an upward move that forms a cup. The prices face resistance at the beginning of the falling trend and the end of the upward trend. Thereafter, a small pullback is seen, after which the prices break out of the upper channel of the handle and finally out of the resistance also. In the chart below, a cup and handle pattern is formed. There is a pullback after the uptrend reaches the resistance line (horizontal line). The pullback is a continuation pattern that can be in any form, like a flag or a pennant etc. A bullish engulfing pattern forms and closes above the resistance line. The next day is a gap with a volume spike, indicating a bullish move.
Conclusion
Swing trading is one of the popular short-term trading strategies as it offers many opportunities to trade and profit. However, there are also some risks of swing trading as it may not always be an easy task to identify the right support resistance, retracements, patterns etc. Nevertheless, it is not difficult to hone technical trading skills. Some practice and commitment are essential. If trading is a business, then one needs to show some commitment.
 0
|
0
|
 0
0

