
 Watch
Watch Positional trading means holding a long or a short position for a longer period, maybe for a few months.  Traders concentrate on long-term price trends and overlook short-term fluctuations. Positional trading in technical analysis is, at times, confused with buy-only strategies. It is not so. It can be a strategy that involves selling also. Technical traders who take positional bets use several price patterns to enter a trade. Some price patterns take time to form on the price charts, like the head & shoulder, the inverse head & shoulder or the cup and handle pattern etc. But whenever they form, they do give a good positional trading opportunity.
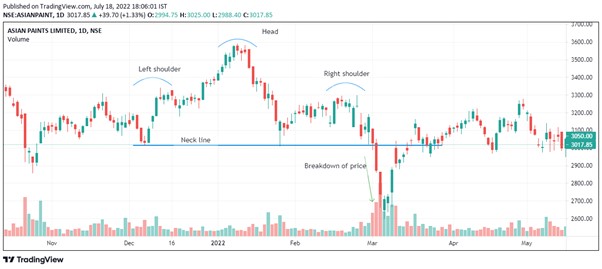
Head & Shoulder this pattern is similar to a human head and shoulders. It is a bearish pattern which forms at the top of an uptrend. A break below the neckline indicates a downward move. In the chart below, a head and shoulder pattern is formed. At the end of the right shoulder, a green candle takes support at the neckline. But the subsequent candle opens much below the close of the green candle but fails to close below the neckline. However, a volume spike indicates the pressure. The next day the price opens almost at the close of the previous red candle indicating the sellers are going to continue with their selling. Aggressive traders may take an entry on the red candle that took support at the neckline on close. The conservative ones might take it the next day morning.
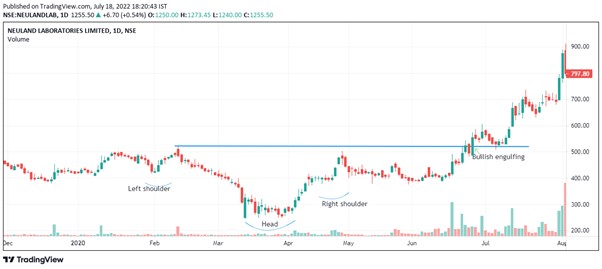
Inverse head & shoulder is the opposite of the head & shoulder pattern. It is a bullish pattern that forms at the end of a downtrend. A break above the neckline can lead to an upward movement. In the chart below, the neckline is broken after prolonged consolidation. An aggressive trader can take an entry at the first candle that touches the neckline. A more conservative trader can take a trade after confirmation. Confirmation occurs when the red candle near the neckline is engulfed by a bullish green candle (bullish engulfing).
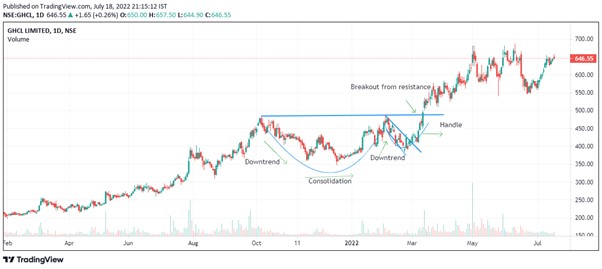
Cup & handle is a pattern that resembles a coffee cup with a handle to hold it. This pattern is bullish. After a long falling trend, the prices consolidate at the bottom and make an upward move that forms a cup. The prices face resistance at the beginning of the falling trend and the end of the upward trend. Thereafter, a small pullback is seen, after which the prices break out of the upper channel of the handle and finally out of the resistance also. In the chart below, a cup and handle pattern is formed. There is a pullback after the uptrend reaches the resistance line (horizontal line). The pullback is a continuation pattern that can be in any form, like a flag or a pennant etc. A bullish engulfing pattern forms and closes above the resistance line. The next day is a gap with a volume spike, indicating a bullish move.
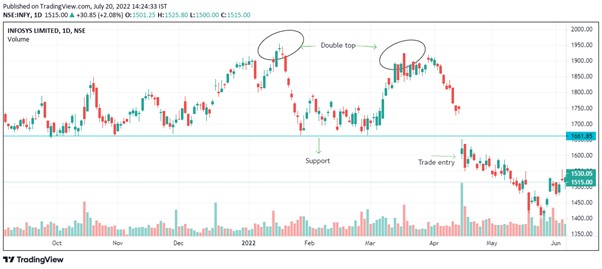
The double top pattern, as the name suggests, is the one where the price reaches a peak and reverses again to form a peak that faces resistance formed by the first peak. The first peak should have been formed after several months of an uptrend. After this, the price declines or pulls back around 10-20% and consolidates before again resuming the upward move. The volumes during the pullback and consolidation indicate very less demand. The rise in prices also happens with less volume. The resistance of the second peak and the subsequent decline must happen with volumes indicating supply is strong. The time between the two peaks that form can be a few weeks to a few months. The peak need not be exact tops. A 2-3% leeway is acceptable. After the prices fall, the support, i.e., the lowest points of both the peaks, should be broken with good volumes for this pattern to be complete. The trade should be entered after the support is broken.
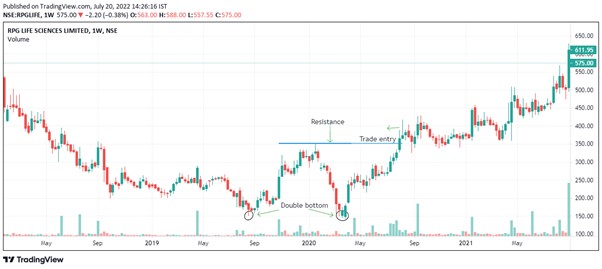
The double bottom is the exact opposite of the double top pattern, where the same rules apply. The first bottom is formed after a downtrend, and a pullback happens, which is around 10-20%. After this, another selling round is seen with lower volumes that form a second bottom. The volumes here are less, indicating the sellers are exhausted. The next upward move is seen with volumes and breaks the resistance that has been formed at the high of both the downtrend that formed the peaks. The entry will be after the resistance is broken.
Conclusion
One of the greatest advantages of positional trading is lesser screen time. A trader doesn't need to stay glued to the trading terminals. Once a trade is planned and executed it only needs to be monitored. It is less risky when short-term moves are ignored, and the trader has the appetite to take on them. However, one risk of positional trading is that it requires more capital that is locked in for a longer time. While the advantage of leverage is there, the risk of liquidity can be high.
 0
|
0
|
 0
0

