
 Watch
Watch Price moves are not linear and are typically driven by demand and supply. Prices move higher when the demand exceeds supply and move lower when supply exceeds demand.  When there is a constant and continuous demand, there is an uptrend, and similarly, when there is a constant and continuous supply, a downtrend occurs. In between the constant buying, there can be a period where the supply is more than the demand and prices fall. But later, buyers come in at lower prices pulling up the demand, and the prices once again resume their uptrend. This is true even during constant supply when demand can be more than the supply, and prices can rise. But later, supply resumes, and prices fall and continue their downtrend.
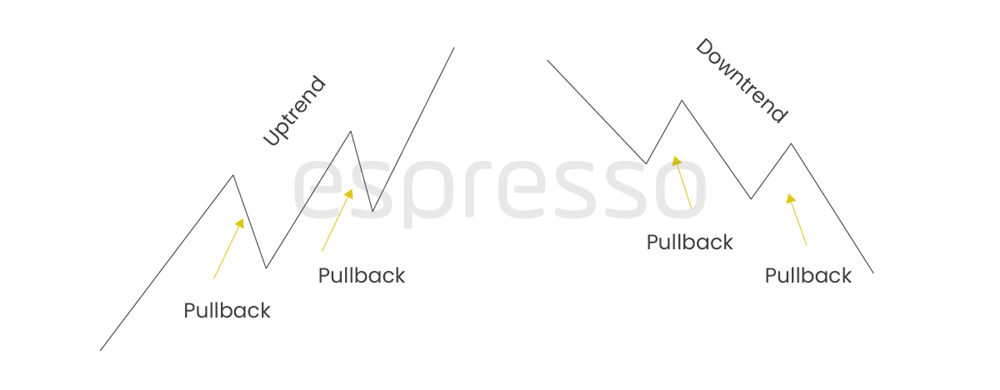
This correction in a trend that happens because of intermittent supply in an uptrend and intermittent demand in a downtrend is what is known as a pullback. And what is pullback trading in technical analysis? Pullback trading involves making use of pullbacks that are opportunities for those who have missed the trend, giving them a chance to ride the trend. However, one has to identify that the intermittent demand or supply is a pullback and not a change in trend.
Identifying pullbacks and advantages of pullback trading
Before identifying a pullback, a trend has to be identified. The traders should know the direction of the trade, failing which a pullback becomes meaningless. The second most important thing is to know the support and resistance areas. The support area is where demand resurges, and the resistance area is where the supply resumes. This is the area from where the pullback happens. Pullbacks can be identified using indicators like moving averages, Fibonacci retracements, trend lines and other similar continuation patterns based on the traders' comfort level. In our example, we shall examine pullbacks using moving averages, Fibonacci retracement and trendlines. Entry into a pullback can be based on the price taking support for going long or facing resistance for going short. The odds also improve if you use candle stick patterns along with the aforementioned patterns to confirm the pullback.
 Moving averages are used as moving support or resistance that can be used for a buying or selling opportunity. Any moving average, depending on the objective of long-term, medium-term or short-term, or swing trading, can be used. A 200-period moving average is used for a long-term objective, while a 50-period works for a medium-term, and the 20-period can be used for a short-term or swing trading objective.
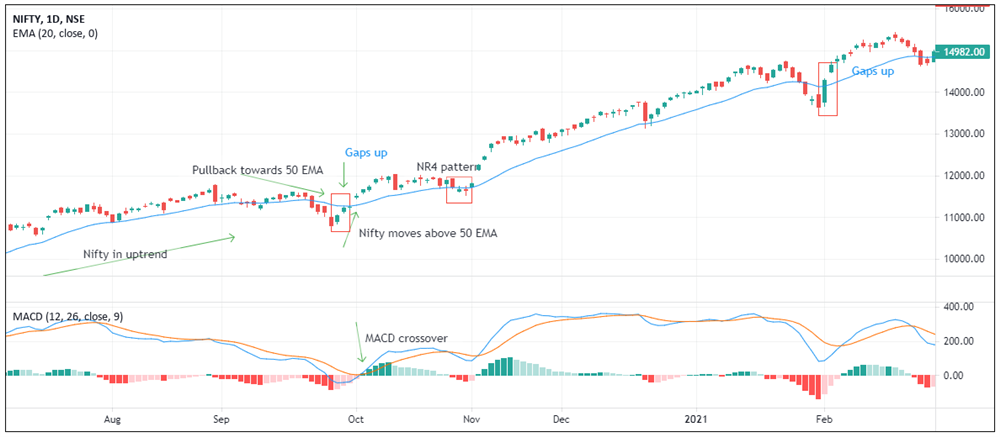
The above chart shows a trend in Nifty as prices have moved away from the 50-period exponential moving average (EMA) for some time. Nifty pulls back to the 50-EMA and also trades below it. Later a positive green candle emerges, after which Nifty gaps up to close above the 50-EMA confirm the pullback. One can take entry after the candlestick pattern confirms the continuation of the original trend. Another pullback happens when the prices touch 50-EMA, and a narrow range of four (NR4) confirms a reversal and continuation. NR4 pattern is a pattern mentioned in the book "Street Smarts" by Linda Bradford Raschke and Laurence A. Connors. The oscillator crossover can also be used as an entry point. In the above chart, the MACD line cuts above the 9-period signal line one can buy at that point.
Fibonacci retracement 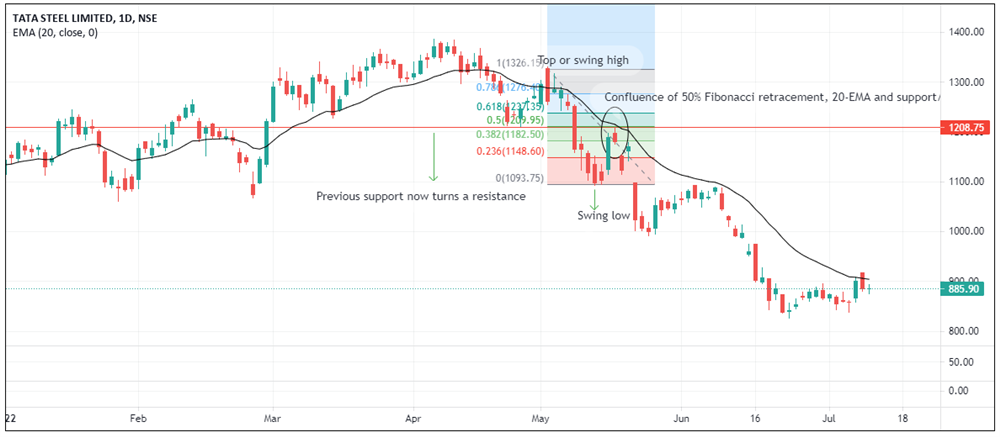 is a tool that traders use to check the level of retracement in a market that has undergone both upswings and downswings. Whenever a price pulls back, traders measure the Fibonacci retracement of the pullback and execute a trade. Using Fibonacci along with a confluence of other indicators like EMA support resistance gives an edge. In the chart below, a short-sell trade is being envisaged. Fibonacci retracement is drawn from the top of the red bearish candle to the swing low of the downtrend. The stock has been trading below the 20 EMA for some time. A Fibonacci line is drawn only after a couple of candles have recovered. The stock finds resistance at 50% retracement where the 20-EMA and a support line that has now become a resistance are in confluence. A short trade can be initiated here by buying at the close. The chart also depicts a continuous downward trend after facing resistance.
Bollinger bands are deemed among the favourite trading indicators that use standard deviation to gauge volatility. Two lines placed above and below a 20-period moving average indicate the price deviation from the average for two standard deviations above and below. If the prices hit the bands, then it means approximately 95 per cent of the data for the 20-period has been achieved, and the price may reverse. 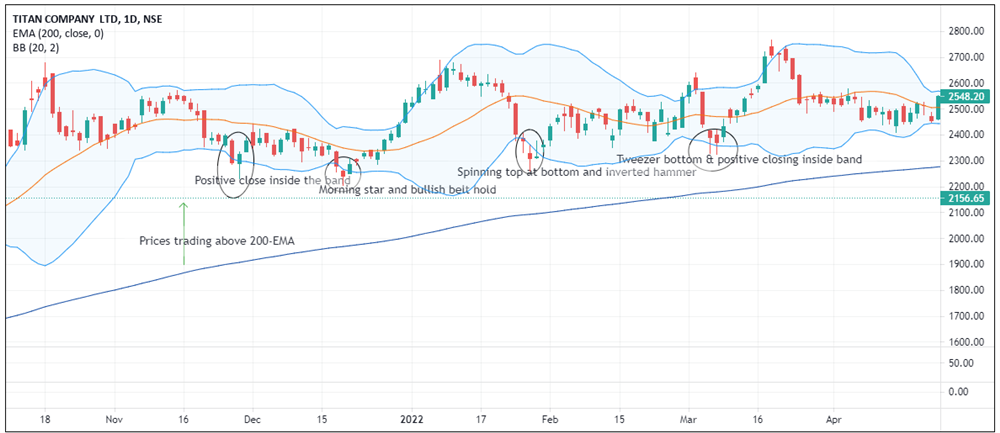 It is a good indicator for entering trades. However, it becomes more effective if it is used along with a 200-period moving average. So, any pullback towards the lower band when prices are above the 200-period moving average can be a possible long trade. Conversely, any pullback towards the upper band when prices are below the 200-period moving average indicates a possible short trade. However, the trade is effective when prices have moved away from the 200-period moving average. If the prices are close to the moving average, then the trend becomes unclear, and trades should be avoided. Before entering the trade, you should wait for a positive candle to close inside the band while placing a buy order. Similarly, you should wait for a negative candle to close inside the band while placing a sell order. If you can identify any candle stick pattern, it would be an added advantage.
Pullback trading Strategy can yield a profit if the entry price, exit price and stop loss are predetermined before entering a trade. However, there are some risks of pullback trading:
- This strategy is valid for a very short window. Without a strict stop loss, heavy losses could be realised.
- If you identify a trend incorrectly, you will end up initiating a trade in the wrong direction and make a loss.
- Don't let your emotions get the better of you. Trading and human emotions should be mutually exclusive.
Conclusion
Pullback trading is one of the most popular trading methods amongst traders and one of the best entry points. However, it is a short-term trading method and lasts for a few sessions. One must be quick to book profits and wait for the next opportunity. A trading plan with clearly defined entry, exit and stop loss is an added advantage.
 0
|
0
|
 0
0

