
 Watch
Watch We’ve seen how prices on charts take distinct forms or shapes to create patterns. Apart from being repetitive, these patterns give insights into the onward journey of prices. They are generally formed when price trends are on the verge of exhaustion.
Patterns are broadly classified as
Continuation pattern
Wedges and their patterns
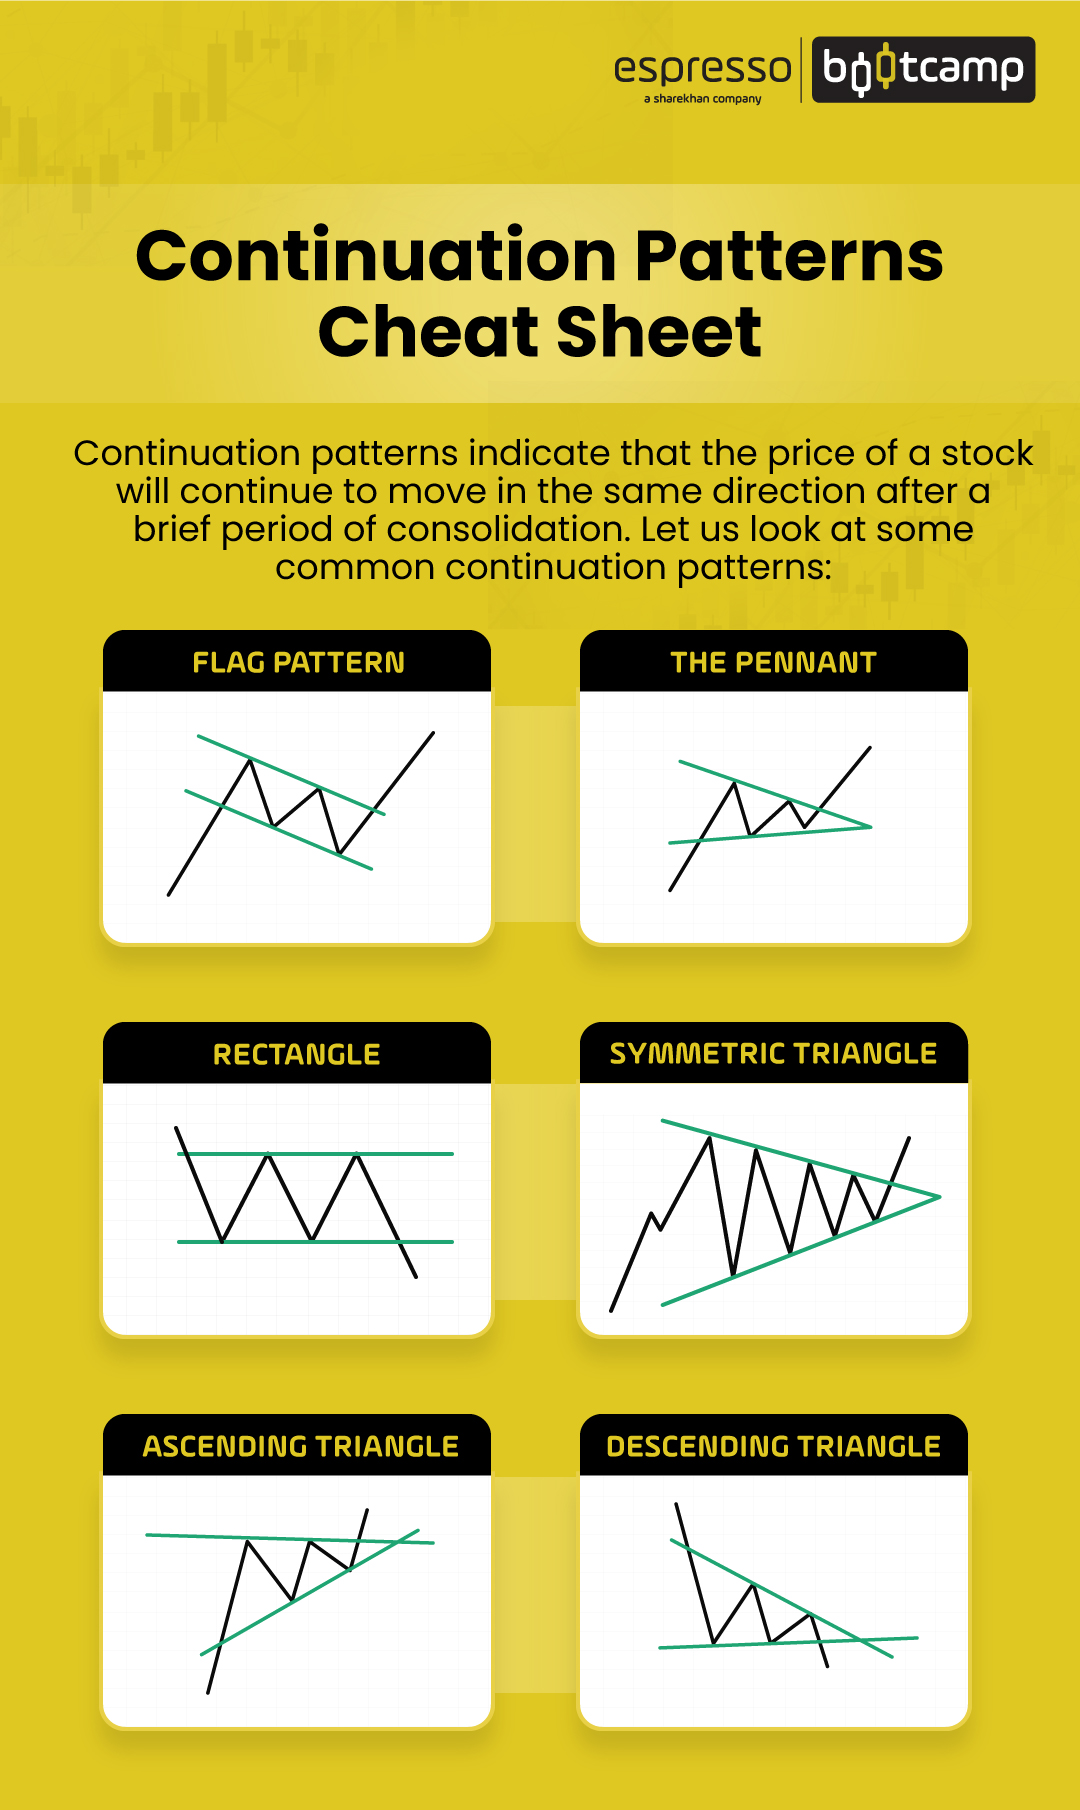
Continuation patterns are formed when the price has been trending and is currently pausing and gaining strength to move in the original direction of the trend.
Here are some popular continuation patterns:
Flag and Pennant
As the name suggests, prices form a pattern that looks like a flag or a pennant. A flag, as we know, is rectangular shaped, while a pennant is narrow and pointed.
A typical flag and pennant pattern has a strong initial move that represents a flag post. After this, the prices consolidate like a fluttering flag or pennant before breaking into the trend's original direction. The initial move that makes a flag post is accompanied by volumes, indicating buying interest. After this, the prices consolidate to form a flag or a pennant.
The flag pattern
- Has two parallel trend lines that do not converge
- Represents the consolidation taking place as prices move within these parallel lines with diminished volume
- It can be upward-sloping in a downtrend and downward-sloping in an uptrend
- It can also be a sideways-moving flag
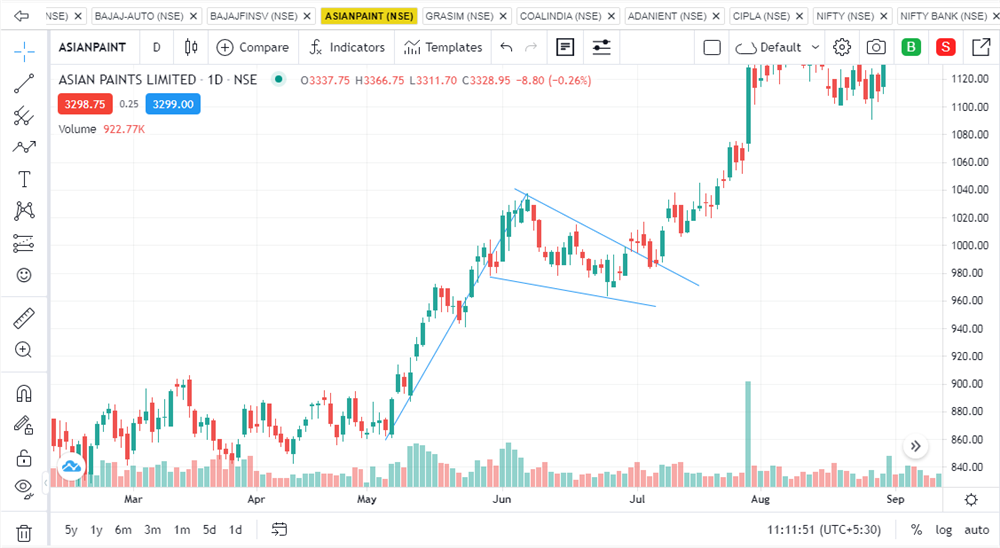
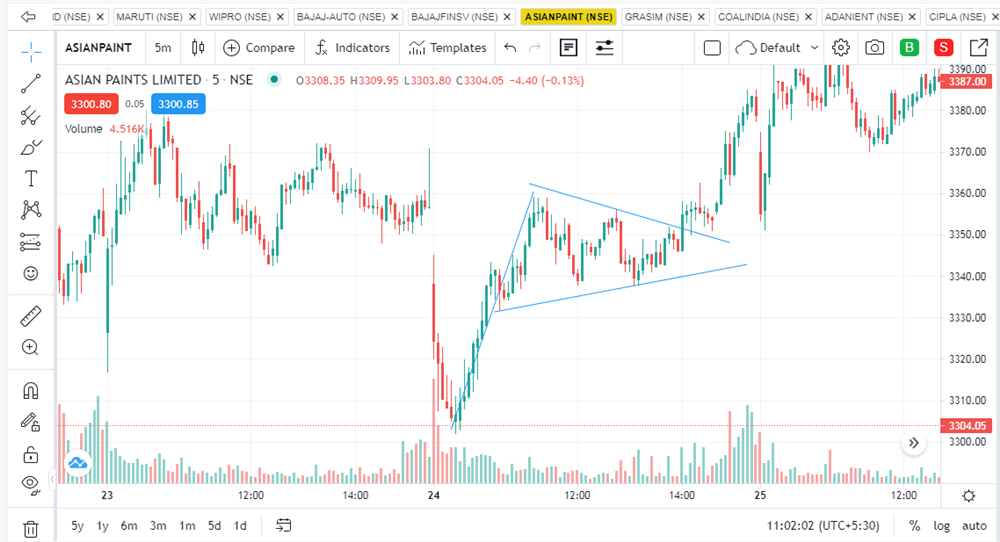
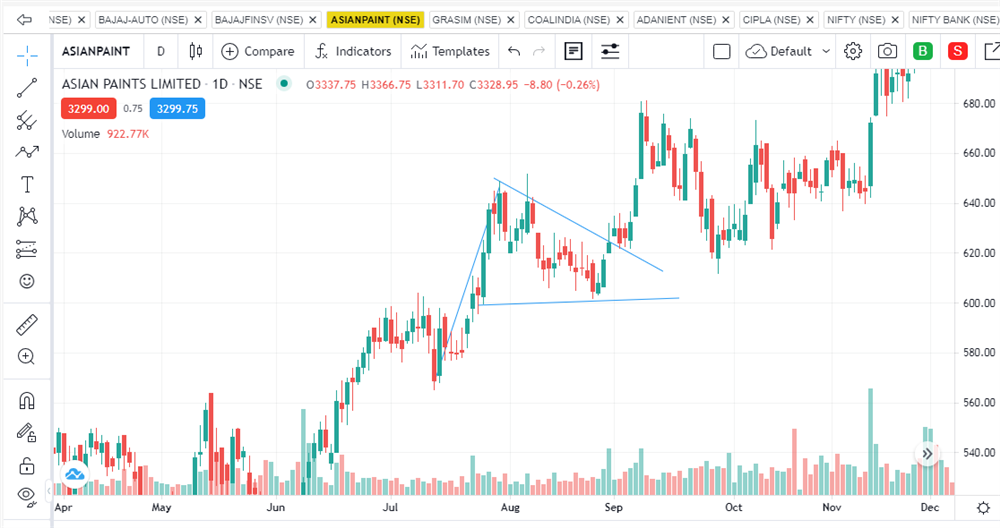
The pennant
- Has two trendlines that converge to form a point or a triangle
- The trend lines connect the lower highs and higher lows to converge before it breaks out in the original direction of the trend
- Slopes downward in an uptrend and upwards in a downtrend
Trade initiation should be after the breach of the trendlines is confirmed. The length of the flag post is assumed to be the target price. The measure is from the point of the breakout of the flag or pennant.
A flag or a pennant can be both bullish and bearish. A bullish flag or a pennant is formed after an uptrend, while a bearish pattern is observed after a downtrend.
Triangles
These patterns are formed when prices move in a tight range before eventually breaching the support or resistance and moving in the direction of the previous trend.
- Triangles are patterns that have trendlines converging at the end, similar to the pennant
- The upper trend lines that connect the highs are the resistance, while the lower trend line that connects the lows is the support
This pattern has three variants:
Symmetric triangle
This has an upper trendline that connects lower highs, while the lower trend line connects higher lows to converge with the upper trendline. The slopes of the upper and lower trendlines are more or less the same; therefore, the trend is not established. In this sense, it becomes a bilateral pattern that can move in either direction.
- An ascending triangle pattern can be both bullish and bearish
- If the prices break down from the lower trendline, it indicates a strong slide down
- If the breakout happened at the upper trendline, it could indicate a strong up move
- It is important to confirm on which side the price breaks out before initiating the trade
- A symmetric triangle pattern is prone to false breakouts therefore stop losses should be in place
- The target is usually the width of the triangle
Ascending triangle
This has a trendline that connects the highs, but the slope remains flat or horizontal, indicating the resistance to be more or less constant. A sharp trendline connects the higher lows indicating buying interest. In other words, the line that connects the highs remains flat to form a resistance until buying pressure results in a breakout on the upside.
- An ascending triangle is a bullish pattern as higher lows are made
- It is formed after a previous bullish trend indicates a strong up move
- Trade should be initiated only after the breakout happens
- The target is usually the width of the triangle
Descending triangle
This is the opposite of ascending triangle. In this, a trendline connects the lows, but the slope remains flat or horizontal. This line acts as support. A sharp trend line connects the lower highs indicating selling pressure. A breach on the downside happens as the pressure of sellers increases, and the support is eventually broken.
- Descending triangles are viewed more like a bearish pattern
- It is formed after a bearish trend can indicate further slide
- Trade should be initiated only after a breakdown happens
- The target is usually the width of the triangle
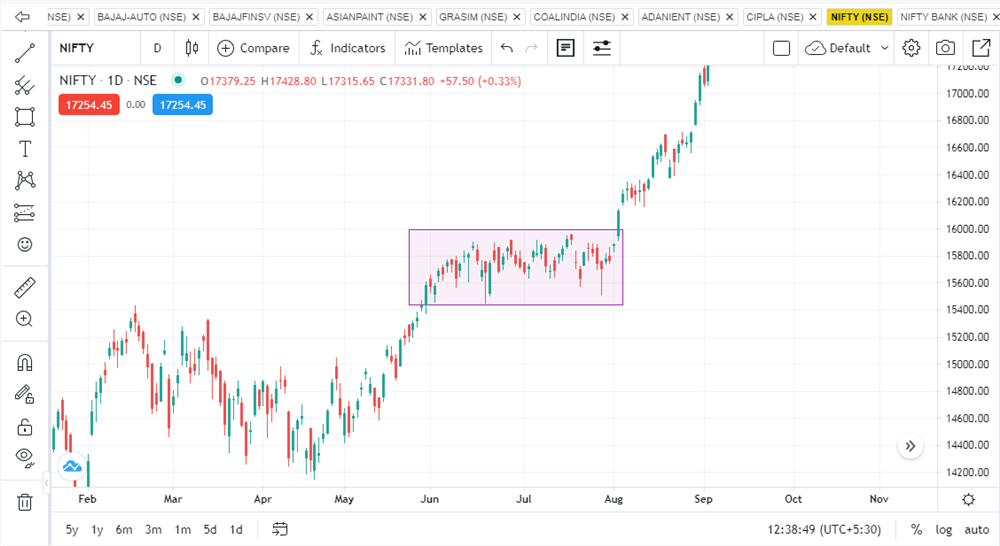
Rectangle
These patterns are fairly simple. They can be identified as an area in the price chart that is bound by support and resistance levels indicating that the prices are range-bound or consolidating. The support and resistance levels will be tested several times before it breaks out.
- A rectangle pattern that is formed after an uptrend indicates a bullish rectangle
- The pattern formed after a downtrend can indicate a bearish rectangle pattern
- In this pattern, the prices consolidate before it breaks down
- The target price is usually the distance between the support and resistance lines
Needless to say, a trade should be initiated after confirmation. Stop losses are a must, as false breakouts are possible in this pattern.
Points to remember:
- Continuation patterns can help traders identify the continuation of a trend after a pause or consolidation.
- Continuation patterns like flags, pennants, rectangles can be bullish or bearish.
 0
|
0
|
 0
0

