
 Watch
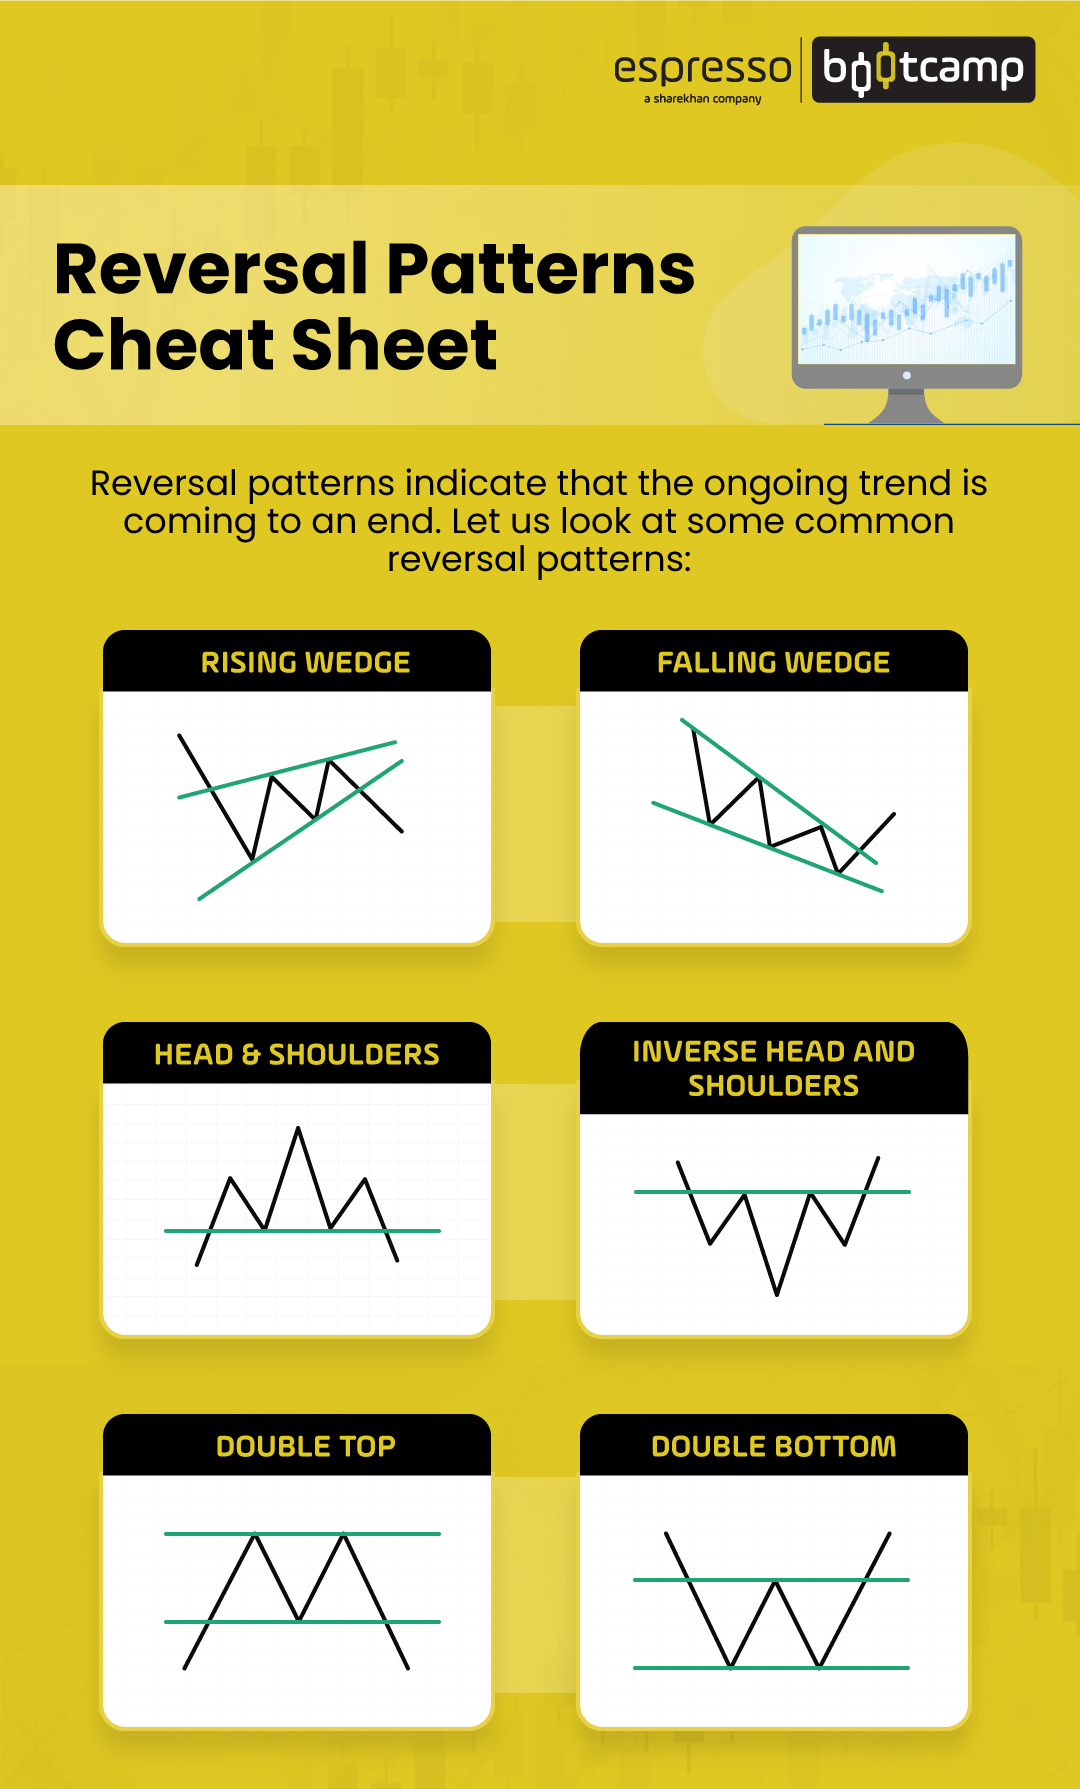
Watch Every trend comes to an end to make way for new ones. In stock markets, trends can be long or short, secular or irregular, and they change at some point to consolidate and reverse. Reversal patterns indicate that the present trend is coming to an end.
A positive trend may pause and reverse and become negative, or a negative trend may pause and reverse to become positive.
Trend reversal, in most cases, forms a pattern that can be recognised and traded. It can be quick or spread out to consolidate longer and take several days to happen. The more time the reversal patterns take, the greater will be the price implication. A longer period of consolidation at the bottom of a falling trend can form a pattern, leading to a reversal. Similarly, a longer period of distribution at the top can lead to a pattern leading to reversal.
Let us look at some of the patterns:
Wedges and their patterns
Wedges are similar to pennants without the flag post with two converging trendlines. However, unlike the pennants, the trendlines move in the same direction. Wedges can be bullish or bearish.
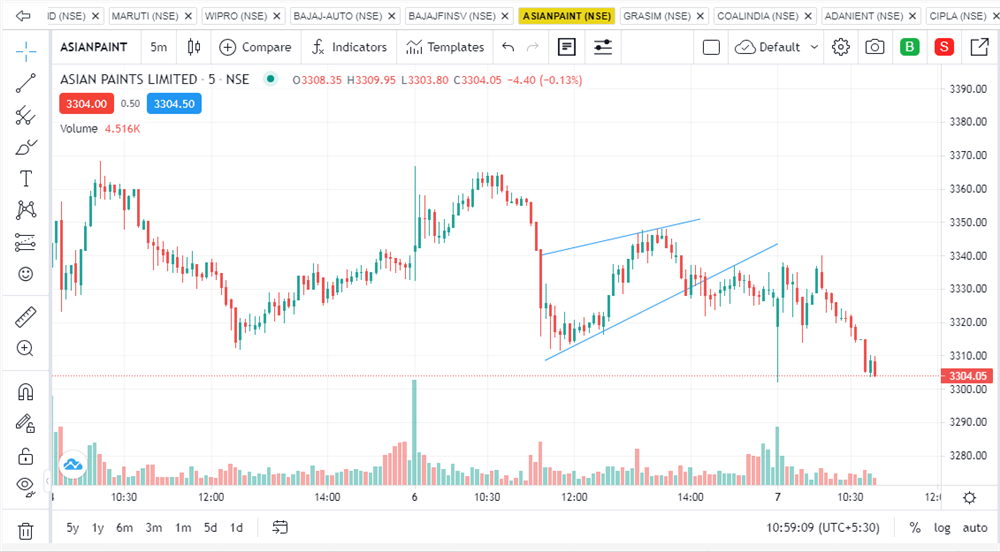
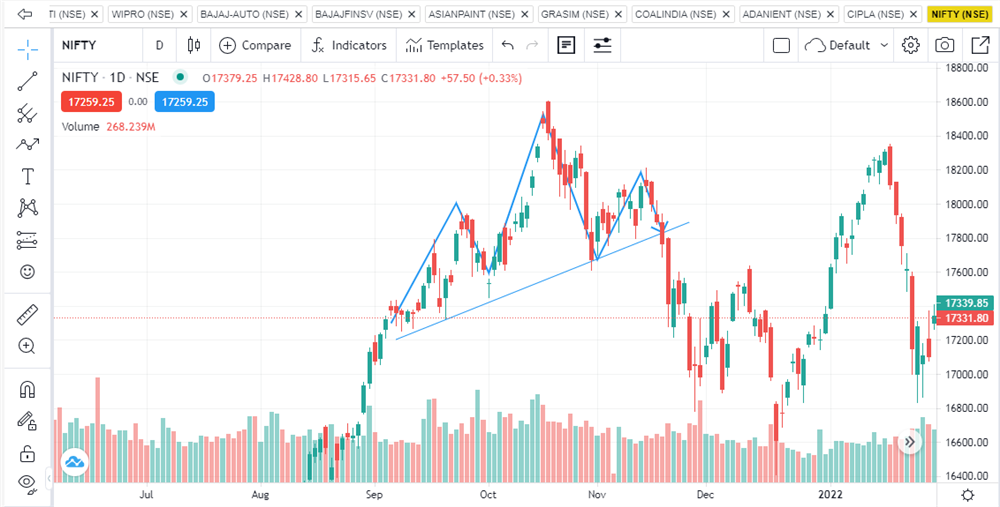
Rising wedge
This is a bearish reversal pattern, which is formed by two upward left-to-right sloping support and resistance lines. In a rising wedge pattern, the lower line is much steeper than the upper one. The prices will eventually breach the support line and prices will break down.
Bear in mind: Rising wedge is a bearish pattern when compared to the bullish pattern of an ascending triangle. Don’t be confused
Rising wedge chart
Ascending triangle
This has a flat or horizontal line that depicts selling pressure at a fixed price or price range. Once the selling is absorbed, the prices break on the upside. In a rising wedge, however, no such fixed price range of supply is noticed. Advancing prices become feebler with each rise. The demand ebbs gradually and prices fall.
A valid rising wedge pattern is one where the price has tested the support line at least three times and the resistance line at least two times or vice versa. It indicates that the bulls are exhausted as the lines converge and the price is unable to move with much vigour from the support levels. Eventually, the support is breached, leading to a confirmation of the pattern. The target price is the height of the wedge at the base.
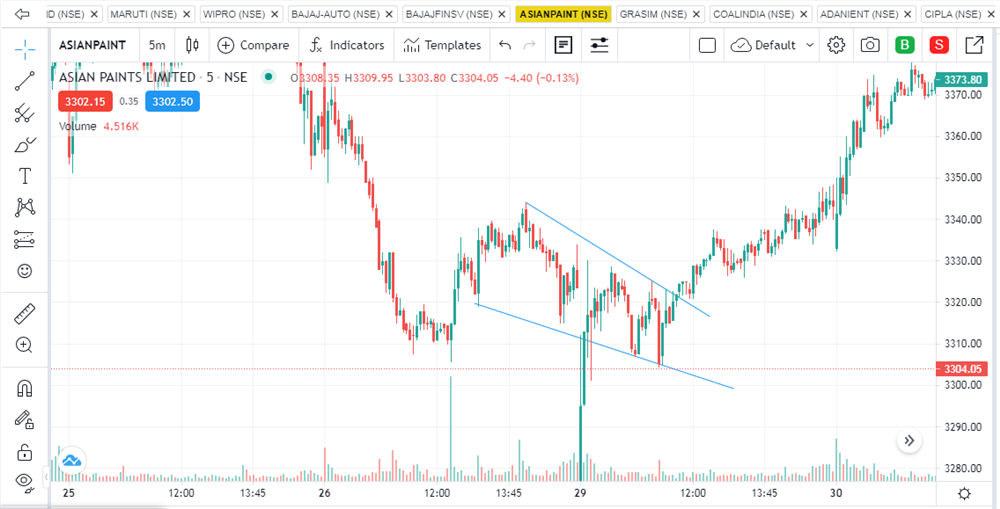
Falling wedge
This is a bullish reversal pattern, where two downward-sloping support and resistance lines converge. This indicates the prices are falling with lesser vigour and are poised for a breakout.
Descending triangle
This has a constant price support line that is horizontal. When the support is broken, prices head down quite rapidly. In a falling wedge, there is gradual buying, and prices may move sideways and gradually rise.
Again, the touch points are similar to a rising wedge. A valid falling wedge has tested more than three times the support line and two times the resistance lines or vice versa. A falling wedge indicates that the sellers are exhausted and a reversal can happen. Once the resistance is taken out the pattern is confirmed. The target price is similar to the rising wedge, i.e., the distance of the base of the wedge.
Head & shoulders
This is a bearish reversal pattern and comprises multiple peaks. This reversal pattern can be compared to a human head and shoulders. This reversal pattern takes time to form and typically has the following price moves:
- An upside move accompanied by good volume and a brief pullback forms the left shoulder.
- After this, another move with high volume forms a higher peak and a pullback till the bottom of the previous move forms the head.
- The third move with lesser volume as compared to the first move and a pullback forms the right shoulder.
- Finally, the price breaks the neckline, i.e., the bottom of the pullback line of both the left and the right shoulder.
- Volume is key to the formation of the head and shoulder pattern.
A head is the highest peak price, and the shoulders are lower than the head and almost equal to each other. The neckline forms the support line. While in theory, this reversal pattern should have an equal shoulder and a horizontal neckline, in practice, the necks can be unequal, and the neckline can be upward or downward sloping. This reversal pattern indicates the prices have peaked and the break below the neckline signals the reversal. The target price here can be the length of the head from the neckline.
Inverse head and shoulders are a bullish reversal pattern. This reversal pattern is the exact opposite of the head and shoulder pattern. The following price moves are to be noted for a valid inverse head and shoulder;
- A downside moves with good volume, and a brief pullback with less volume forms the left shoulder.
- Another decline below the bottom of the left shoulder must be accompanied by volume, albeit lower than the left shoulder decline. This is followed by a pullback till the top of the previous move forms the head.
- Another decline with lesser volume is followed by a pullback forms the right shoulder.
- Finally, the price breakout of the neckline reverses the downtrend.
This reversal pattern indicates the prices have bottomed out, and the break above the neckline signals the reversal.
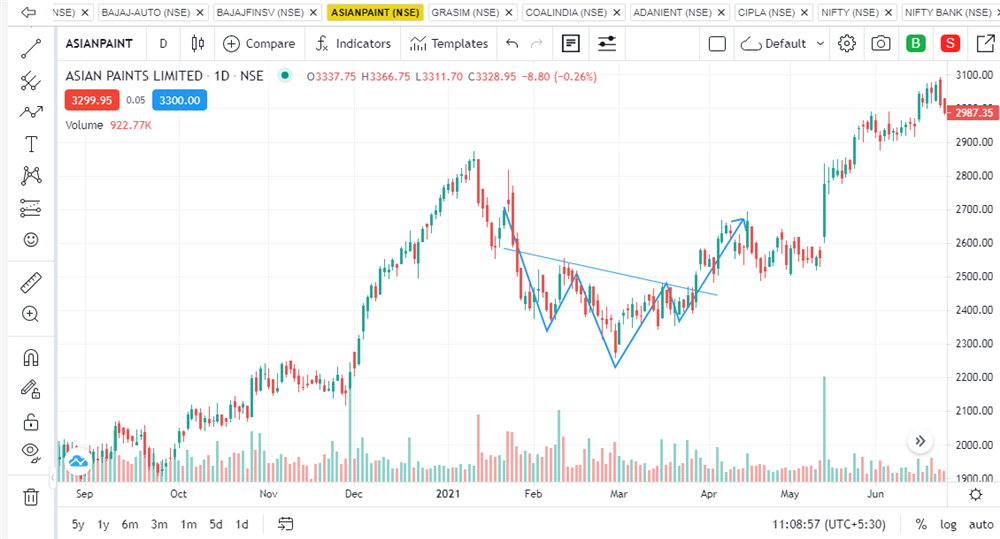
A double top is a bearish reversal pattern where the price hits a peak top twice and faces resistance at that level. This formation happens when prices advance to a certain level with high volumes and recedes with lower volumes to form a top. The prices again advance to the previous top with lesser volumes than the previous move and recede to form another top and take support at the neckline. There is selling pressure at that level and prices are unable to move beyond that point. The bottom of this pullback is the neckline for the double-top pattern. After the prices hit the second peak, the neckline is tested and when it is broken, the pattern is confirmed. The target price is the distance between the neckline and the top. Stop losses are a must, as reversals are not 100 per cent guaranteed.
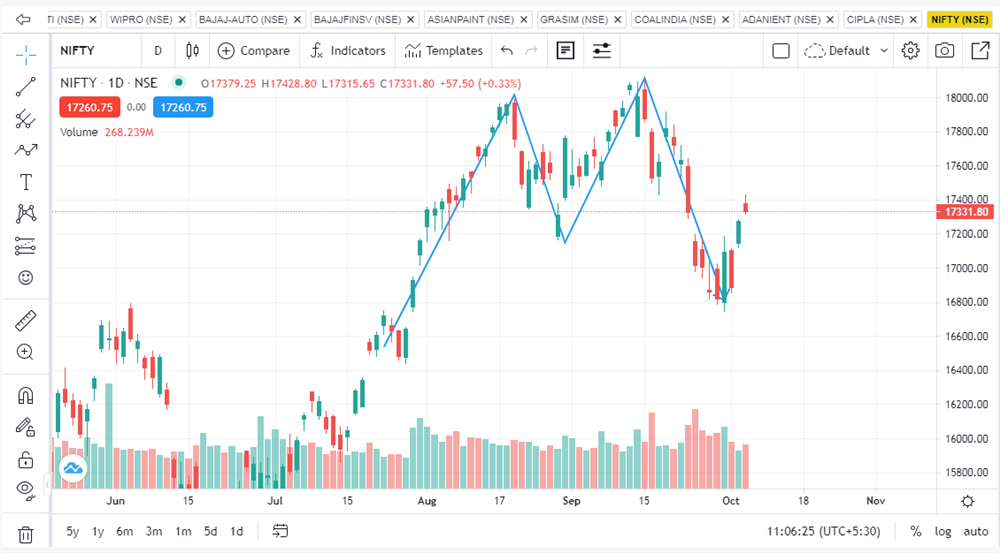
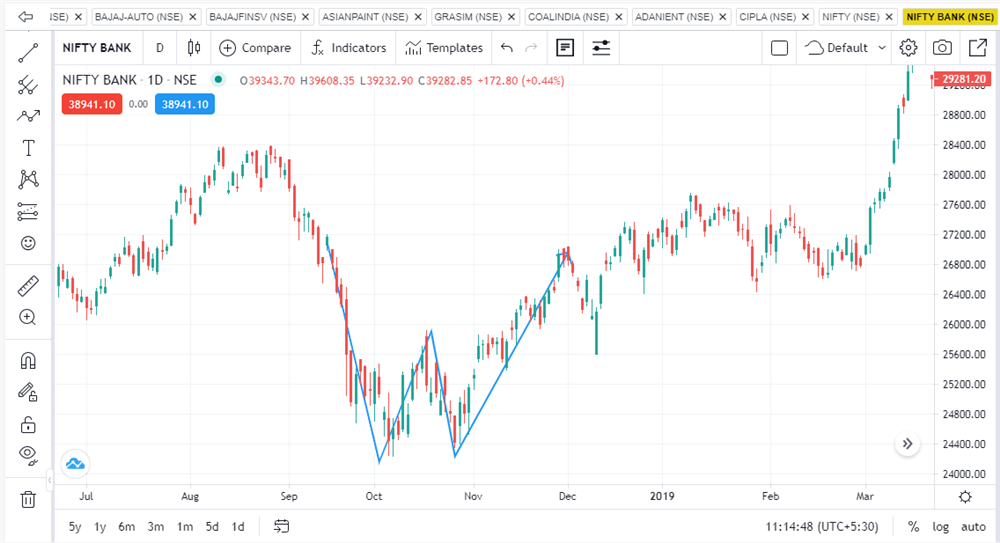
The double bottom is a bullish pattern and the exact opposite of the double top pattern. This formation happens when prices decline to a certain level with high volumes, only to pull back with lesser volumes to form a bottom. The prices again decline to the previous bottoms with lesser volumes than the previous move and pull back to form another bottom. There is resistance at the neckline of the pullbacks. Once the neckline is broken, the pattern is confirmed. The target price is the distance between the neckline and the bottom.
Here the selling pressure is exhausted, and the buyers are getting active. The neckline is formed after the first bottom is made, and there is a pullback. The top of the pullback from the first bottom point is the neckline. After the second bottom, the neckline is tested and when it is breached, the pattern is confirmed. Stop losses are to be kept in case the pattern fails.
Patterns with triple tops and triple bottoms can also form. However, their appearance is rare.
Conclusion
One of the most important utilities of knowing chart patterns is one knows what is to be done. What is to be done is more or less known to the trader and needs to be implemented because the patterns are repetitive, and so are their outcomes. However, one needs to practice identifying these patterns before jumping to trade the patterns. Also, patterns need not behave the way they are supposed to, as other market factors can overshadow these.
 0
|
0
|
 0
0

