
 Watch
Watch We will dive deeper into technical analysis in this module, by trying to understand what is chart pattern in stock market. Let’s begin with an introduction to chart patterns.
As we have seen, the artistry aspect of stock trading is seen as patterns that shape up when prices take distinct forms or shapes. These patterns called chart patterns in stock market give a clue on price moves and whether they will continue or reverse.


Prices, as you already know, are determined by demand and supply, which in turn are driven by (you know again!) our emotions. Every price that we see flashing in front of us evokes an emotion, be it greed, fear, need, compulsion, joy or security. Patterns, therefore, are nothing but an aggregate of human emotions – a collective emotional state known as market psychology.
Chart patterns in technical analysis are one of the most popular methods of trading. As market psychology determines chart patterns, like human emotions and actions, they, too, are repetitive.
The other important aspect of patterns is it also determines the behaviour or response to the pattern, which is also repetitive.
For example, we have often noticed that price takes support at a particular level, and demand is created as buyers become interested, and when there is resistance, the sellers become active, and there is supply pressure.
Use of chart patterns
Eliminating emotions: This is the primary motive of chart patterns. Random and emotional traders are aplenty, who create demand and supply imbalances, resulting in price patterns. An experienced trader is quick to identify this and capitalise on the emotional mistakes of their less-experienced counterparts.
Gauging market sentiment: Chart patterns help in gauging market sentiment and anticipating a change in price direction or trend. Since the chart patterns are repetitive, it is easy to assess or project the next price move and the probable target price.
Define rules: Traders can define a set of rules for each chart pattern, like when to enter or exit, what timeframe to trade in and how to determine to stop losses and trade accordingly. This also helps eliminate randomness in trades.
Classification of chart patterns
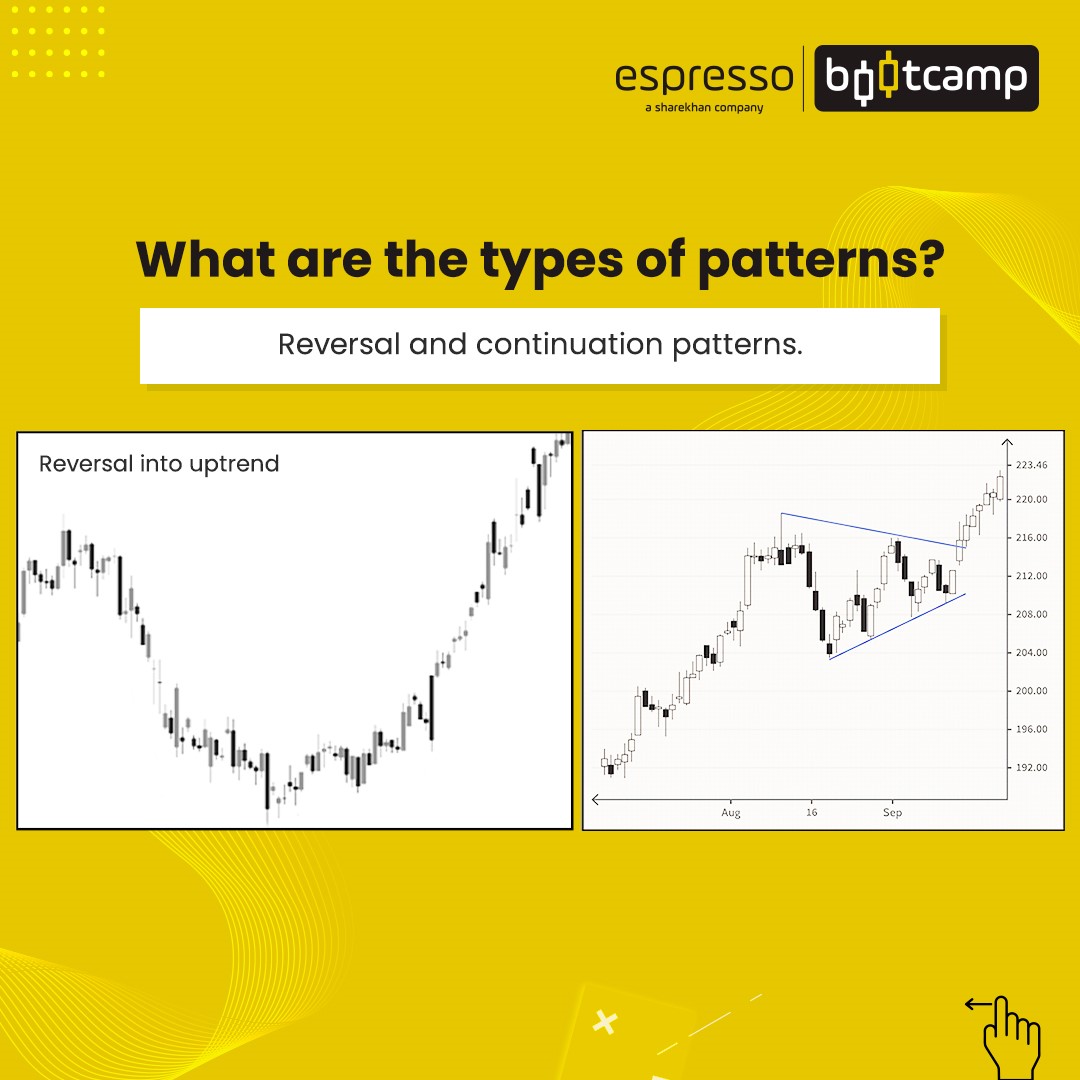
Chart patterns are classified as continuation and reversal patterns.
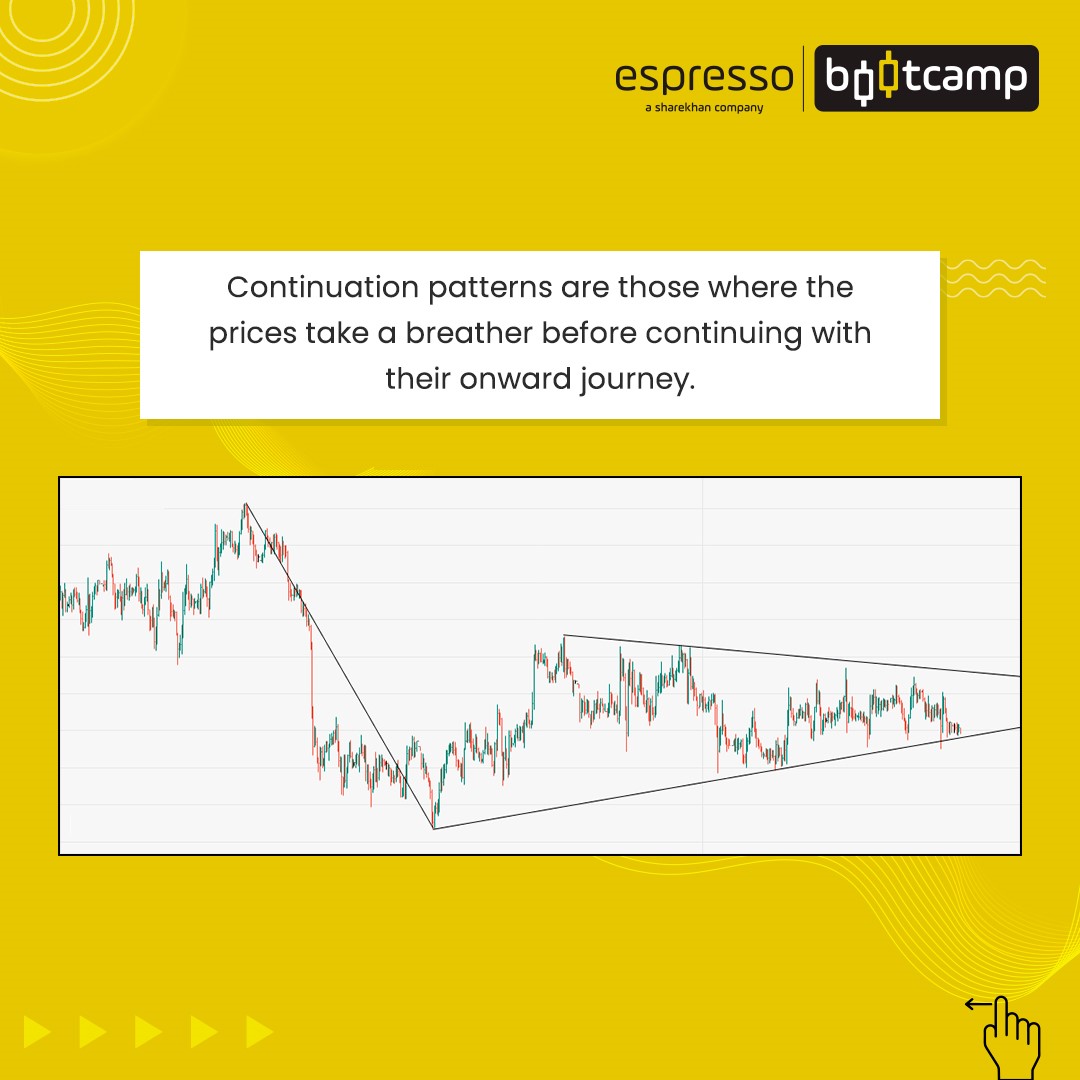
- Continuation patterns are those where the prices take a breather before continuing with their onward journey.
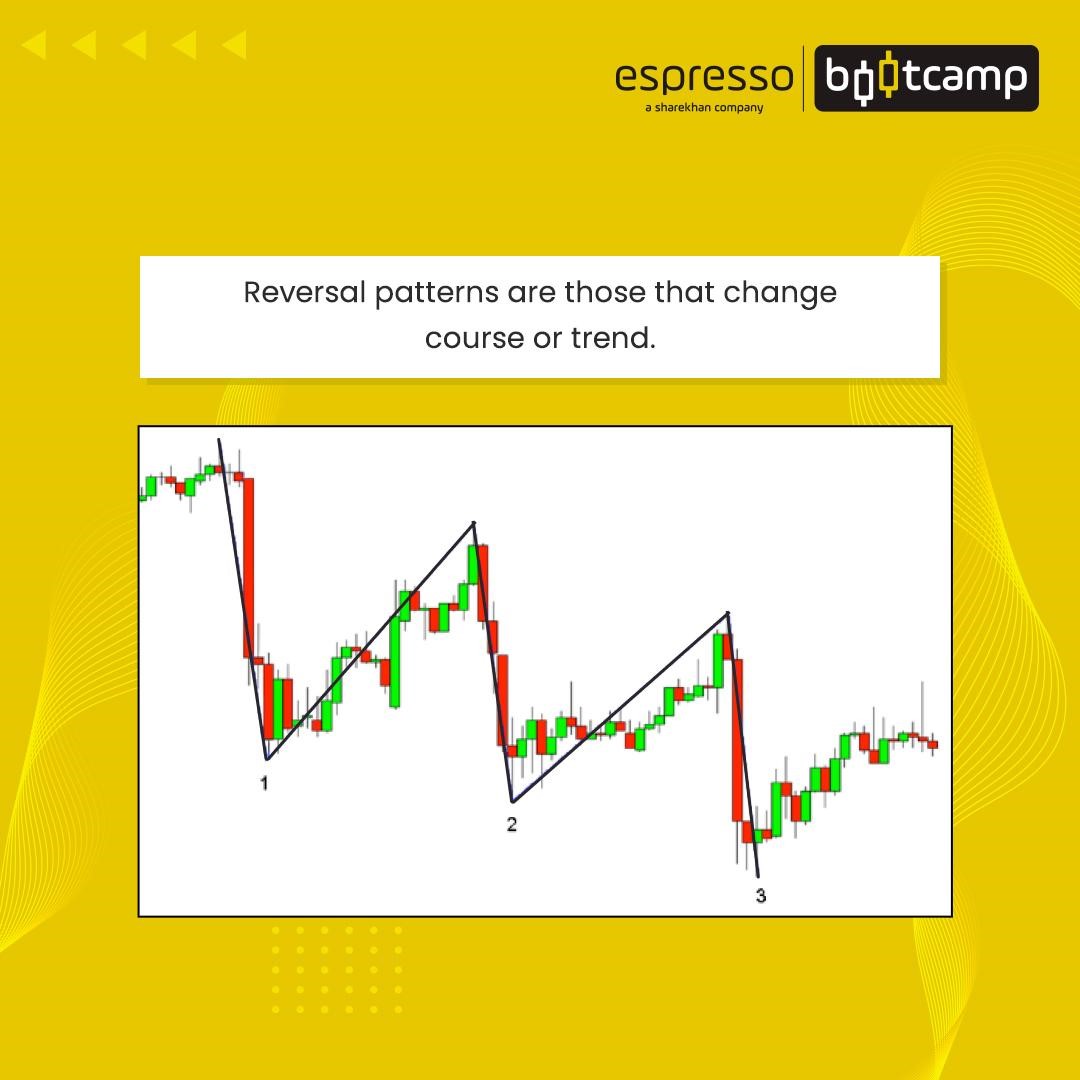
- Reversal patterns are those that change course or trend.
Traders are always in a dilemma when they are already in a trade or want to enter into a trade when the prices are trending. Deciding to enter or exit under such circumstances can be difficult. Where the prices will move can be anybody’s guess. This is where continuation chart patterns come in handy as they indicate the likely resumption of the trend after a pause and also how far the prices can move further.
Some popular continuation chart patterns:
- Flags and pennants
- Triangles
- Rectangles
Similarly, it is also difficult for a trader when the trend is over, and a reversal is about to happen. The dilemma here is if a new trade can be initiated or if an existing trade can be exited. Reversal patterns are good indicators to identify the end of a trend.
Some popular reversal patterns:
- Head and shoulders
- Inverse head and shoulders
- Double top and double bottom
- Wedges
Some chart patterns tend to be bilateral – they’re both continuation and reversal.
Examples include:
- Wedges
- Triangles
It is, therefore, crucial to wait for the confirmation of a chart pattern before entering a trade – bringing us to the important question…
How to identify chart patterns?
Identifying chart patterns is easy, but you must understand it requires practice and experience. Once you reach a certain level of comfort, you will be able to identify patterns at a glance. Therefore, do some homework on pattern identification before jumping into a trade.
- The most common aspect of pattern trading is drawing support and resistance lines. It is important to get familiarised with how to draw them.
- Support and resistance are areas of active demand and supply.
- Support areas are those where prices fail to go any further down as buyers become active.
- Resistance areas are those where prices fail to go any further up as sellers become active.
- If a trader becomes proficient in identifying support and resistance, understanding chart patterns is just a cakewalk.
Points to remember
- Chart patterns are fallible as there is no guarantee that a pattern to behave the way it should behave.
- Things can go against a trader as the markets are dynamic and are in a continuous mode of digesting information.
- As new information or variables emerge, the market can react, and chart patterns can fail.
- One must have stop losses in place to minimise losses.
 0
|
0
|
 0
0

