
 Watch
Watch By now, you have a broad understanding of technical analysis. In this chapter, let's try and understand what are trends in technical analysis. A broad Oxford Learner’s Dictionary defines a trend as a general direction in which a situation is changing or developing. This is applicable in several contexts, including social, economic, political, demographic and fashion, among others. Trends in stock market context refer to a continued direction of prices that could be upward, downward or flat.
What are trends in technical analysis?
- Trends are based on historical prices, but the ultimate purpose is to forecast future trends
- They are used to identify market or individual stock movement along with volumes
- They are used by traders or investors to plan an entry or exit, accordingly
Before we proceed, let’s learn some popular market adages on trends:
A trend is your friend.
Trade with the trend.
Types of Trendlines in technical analysis
As we’ve already learnt before, there are three types of trends.


Upward trend
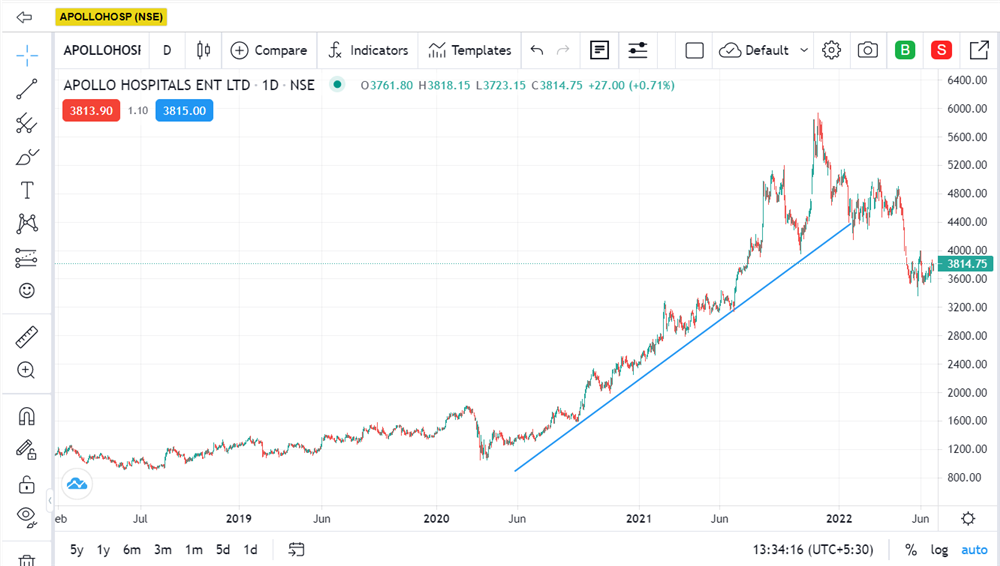
- An upward trend of a stock or an index is formed when the price makes higher highs and higher lows.
- There is an ascending movement for a bullish upward trend.
- In an upward trend, the stock prices or market will have consecutive higher peaks and troughs.
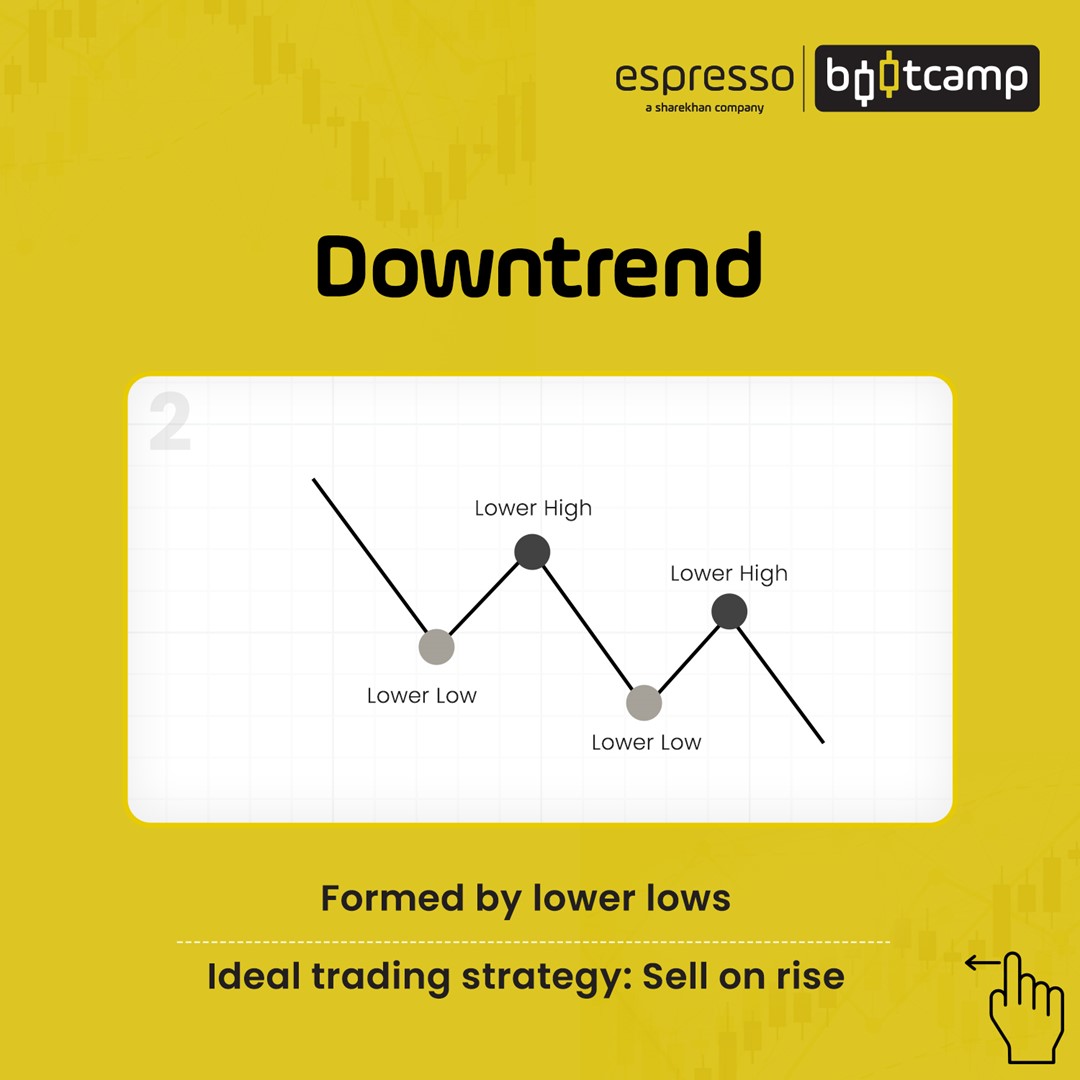
Downward trend
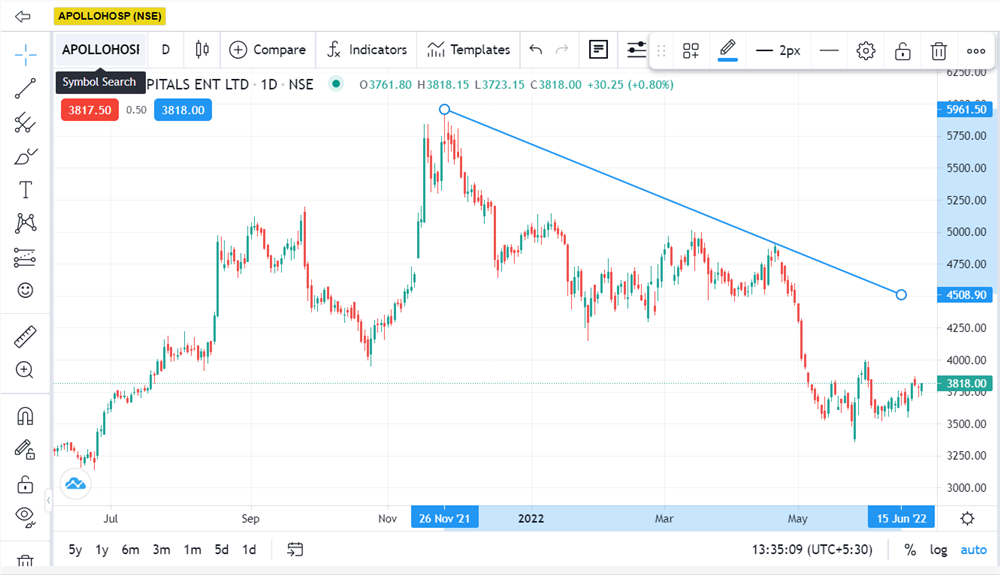
- A downward trend of a stock or an index is formed when the price makes lower highs and lower lows.
- There is descending movement bearish downward trend.
- In a downward trend, the stock prices or market will have consecutive lower peaks and troughs.
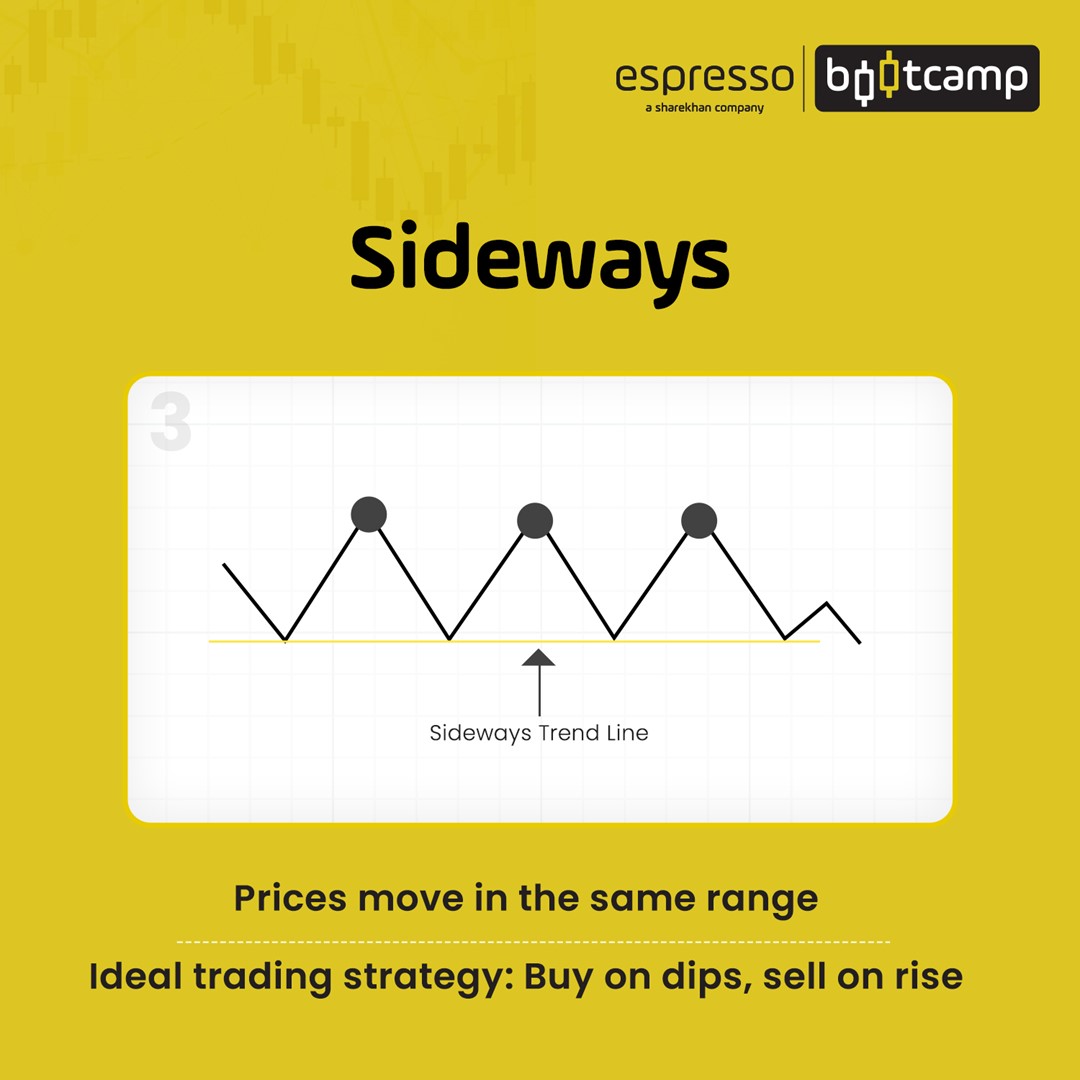
Flat or horizontal trend
A flat or horizontal trend, also known as sideways movement, happens when the stock prices or the market moves in a horizontal range.
Remember the Dow theory from the previous chapter? The theory classifies trends as primary, secondary or minor. It also defines the trend in various periods it will last.
- Primary trend lasts around one to three years.
- Secondary trend lasts three weeks to three months.
- Minor trend lasts less than three weeks.
How long do trends last?
- A trend lasts until a reversal takes place, which is nothing but movement in the opposite direction flat or horizontal trend.
- Trend reversals can be bullish or bearish
- Bullish reversals happen at the peak of a bull run.
- Bearish reversals happen at the bottom of a bear grip.
- Identifying trends and reversals is like an art and takes years to get a hang of.
How to identify trends
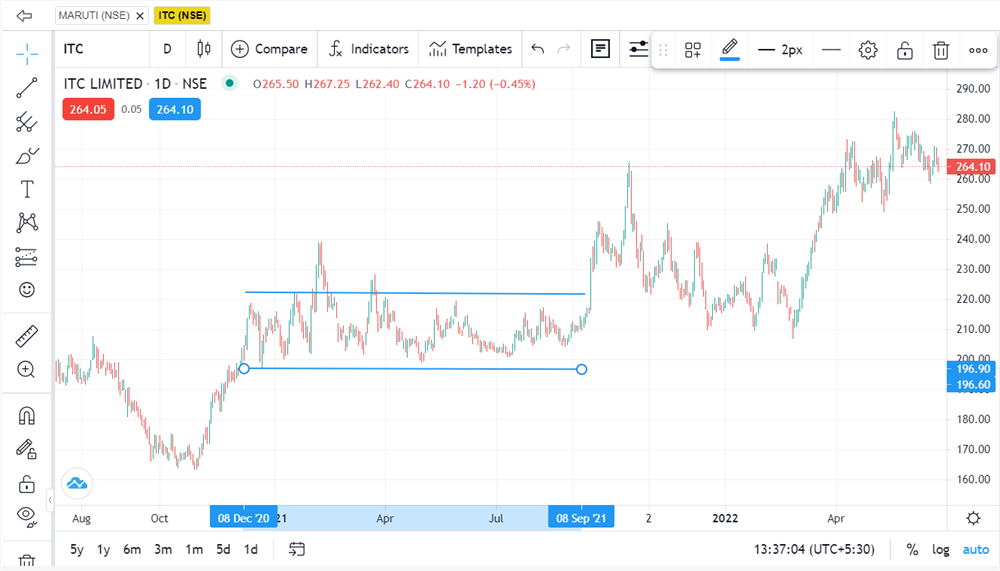
Economics says the price is driven by the demand-supply dynamics. A rising or falling price trend is usually supported by good volumes. As mentioned above, a bullish trend can be identified if a price is making higher highs and higher lows. Lower highs and lower lows determine a bearish trend. This is also known as trend identification based on price action.
Other methods of identifying trends
Simple moving average (SMA)
A simple moving average is plotted on the price chart as the average price of a stock or an index over a specified period. SMA is plotted as a line and keeps moving as and when a new price bar is formed. The slope of the line determines the trend of the stock or index.
An upward-sloping SMA is a bullish trend, and a downward-sloping SMA is a bearish trend. For trading, one must see if the price closes above the SMA after it has seen a reasonable downtrend in case of bullish bias. In case of a bearish bias, the price has to close below the SMA after the price has seen a reasonable uptrend.
The 200-bar, 100-bar or 50-bar SMAs are the most popular ones used by traders.
- The 200-bar is used to identify long-term trends.
- The 100-bar and 50-bar SMAs are used for identifying medium to short-term trends.
- Day traders use a shorter period of 7-bar, 9-bar or 14-bar SMAs.
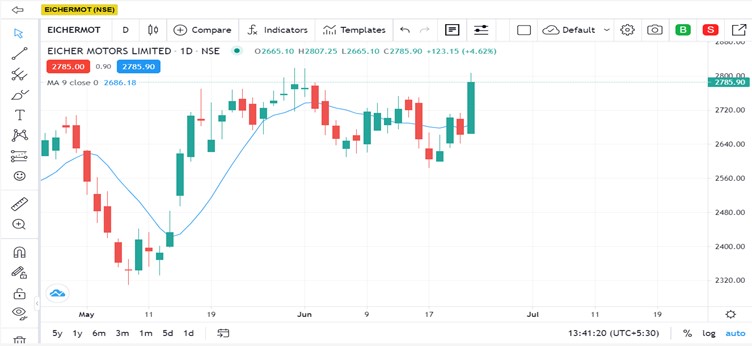
The chart below shows how the prices move rapidly when it closes below and above the 9-bar SMA.
Exponential moving average (EMA)
An exponential moving average is similar to the simple moving average with the exception that the recent price gets more weightage. EMAs are useful for trend as well as support resistance areas. Again, like SMAs, the slope determines the trend of the stock or index.
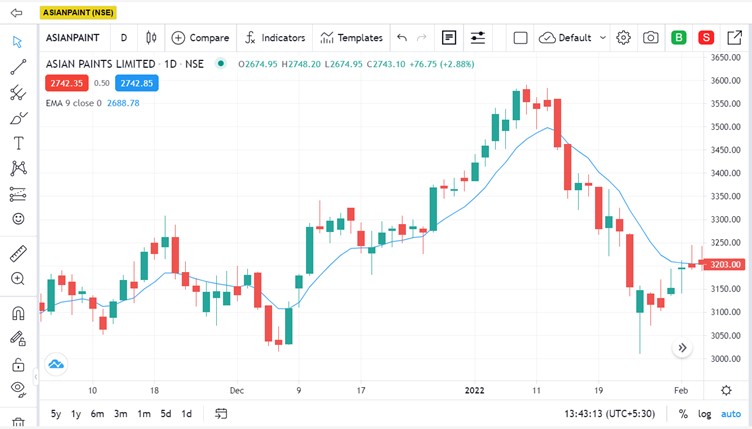
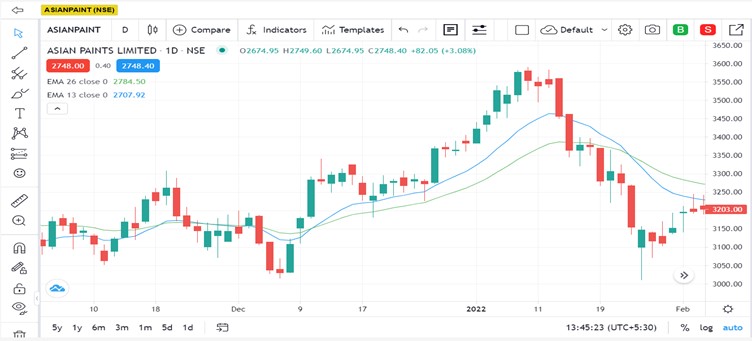
The chart below shows how the stocks trend up and trend down after closing above and below the 9-bar EMA.
Moving average crossovers
It is better to use moving average crossovers instead of a standalone moving average. Crossovers are plotted by using multiple moving averages like the 50-bar, 100-bar or 200-bar moving averages and determine if all averages are moving in the same direction, thereby confirming the trend.
The moving average with a lesser number of bars is faster, while the moving average with a greater number of bars is slower.
A positive crossover happens when a faster-moving average crosses above a slower-moving average, giving a bullish signal. A bearish crossover happens if a faster-moving average crosses below a slower-moving average. One can use either SMAs or EMAs for crossovers.
Long-term crossover of moving average
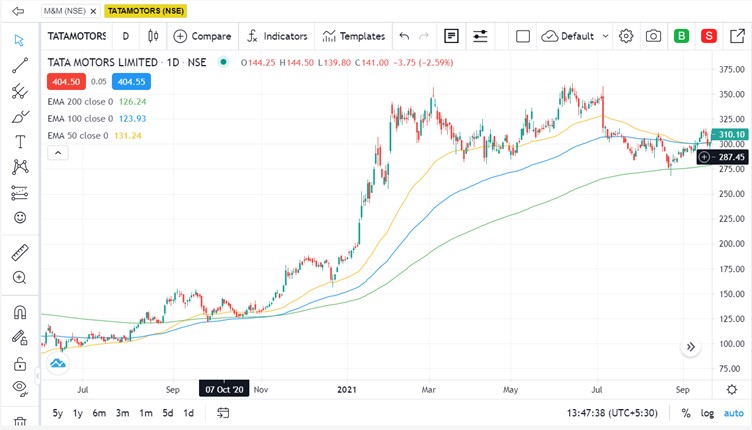
Short-term crossover of moving average
Moving average convergence and divergence (MACD)
.jpg)
This is one of the most popularly followed technical indicators or oscillators used by traders to identify trends. It is a simple indicator that uses 12-bar and 26-bar EMAs, and calculates their difference and a line is plotted known as the MACD. Another 9-bar EMA is also used as a signal line.
A histogram is also plotted that tells the difference between the MACD line and the signal line. The strength of a trend is measured against a zero line. If MACD crosses above the zero line, it implies an upward trend. If it crosses below the zero line, it implies a downward trend.
For a buy signal, MACD should cross above the signal line. For a sell signal, MACD should cross below the signal line. MACD acts as an oscillator and is not overlayed on the price chart.
Points to remember
- Understand the market trend to time entry and exit.
- Since historical prices are used, one must appreciate that history need not repeat.
- Trend continuation or reversal needs to be confirmed.
- Trends at a higher time frame give a better picture.
- A little practice can be helpful in this regard.
 0
|
0
|
 0
0

