
 Watch
Watch “The stock is ready for a breakout”, “the stock ran up and witnessed a great breakout”, or “the stock is witnessing a break-down” - are some of the phrases that are regularly used by market experts/analysts while analysing the performance of a stock.
So what exactly is a breakout?

A stock is supposed to be witnessing a breakout when its price starts moving beyond the defined support and resistance levels, which is also accompanied by a spurt in volumes. Traders using the break-out strategy use this break-out above the resistance levels to go long in that stock. Conversely, if the stock breaks down its support levels, the traders will short their position.
It may be noted that once the stock moves beyond these barriers (supports & resistance), the volatility in the stock’s price tends to surge, and the prices tend to follow the direction of the break-out.
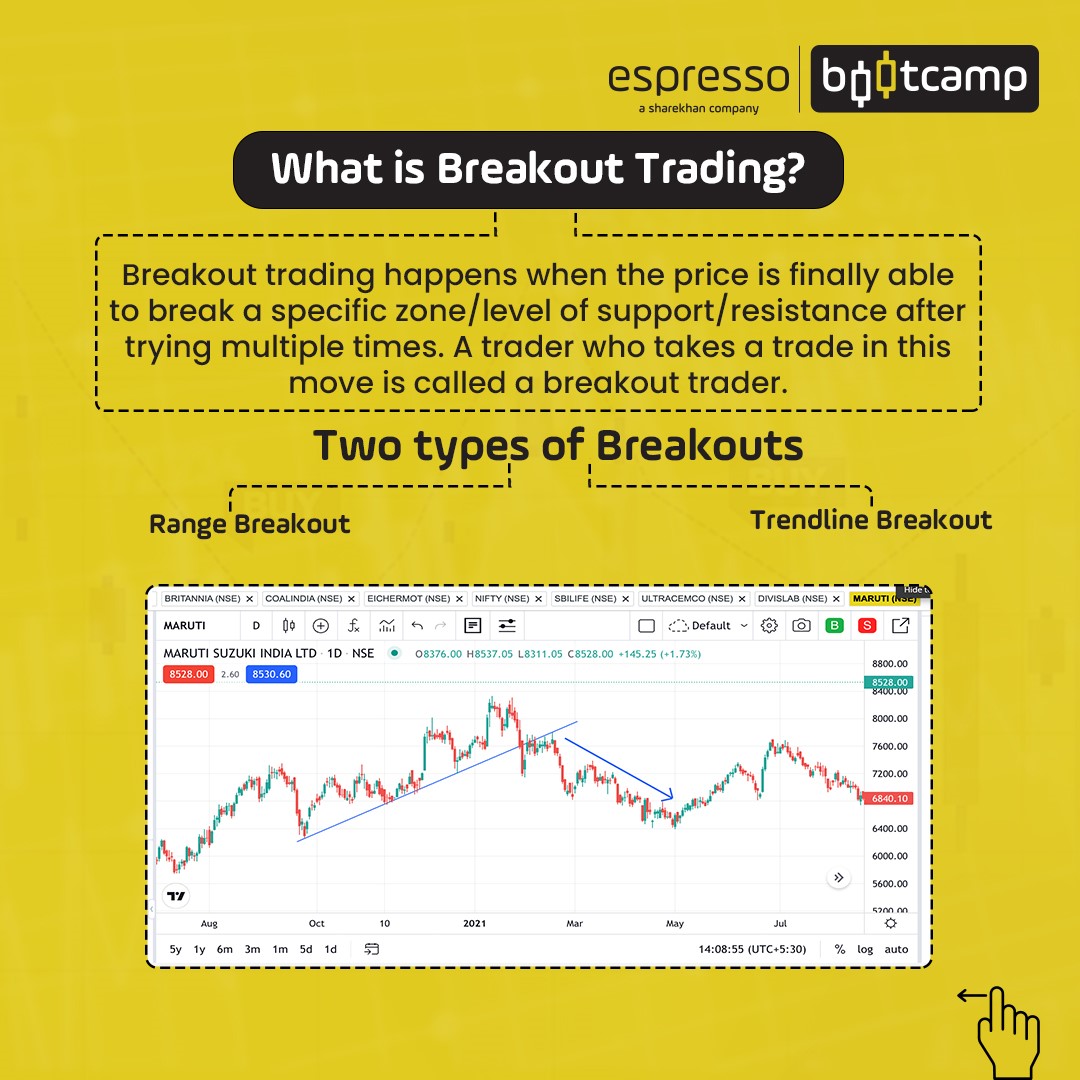
What is breakout trading?
Breakout trading in technical analysis is a kind of momentum trading where the trader enters and exits the trade quickly within the same day. Since the movement of price outside the key support and resistance levels holds the key in breakout trading, the traders always endeavour to enter the trade right at the cusp of the breakout so that they can ride the tide for the maximum time possible. This requires traders to be extremely swift in their mind and action, and any delays can quickly erase the potential benefits.
How do traders use the breakout trading strategy?
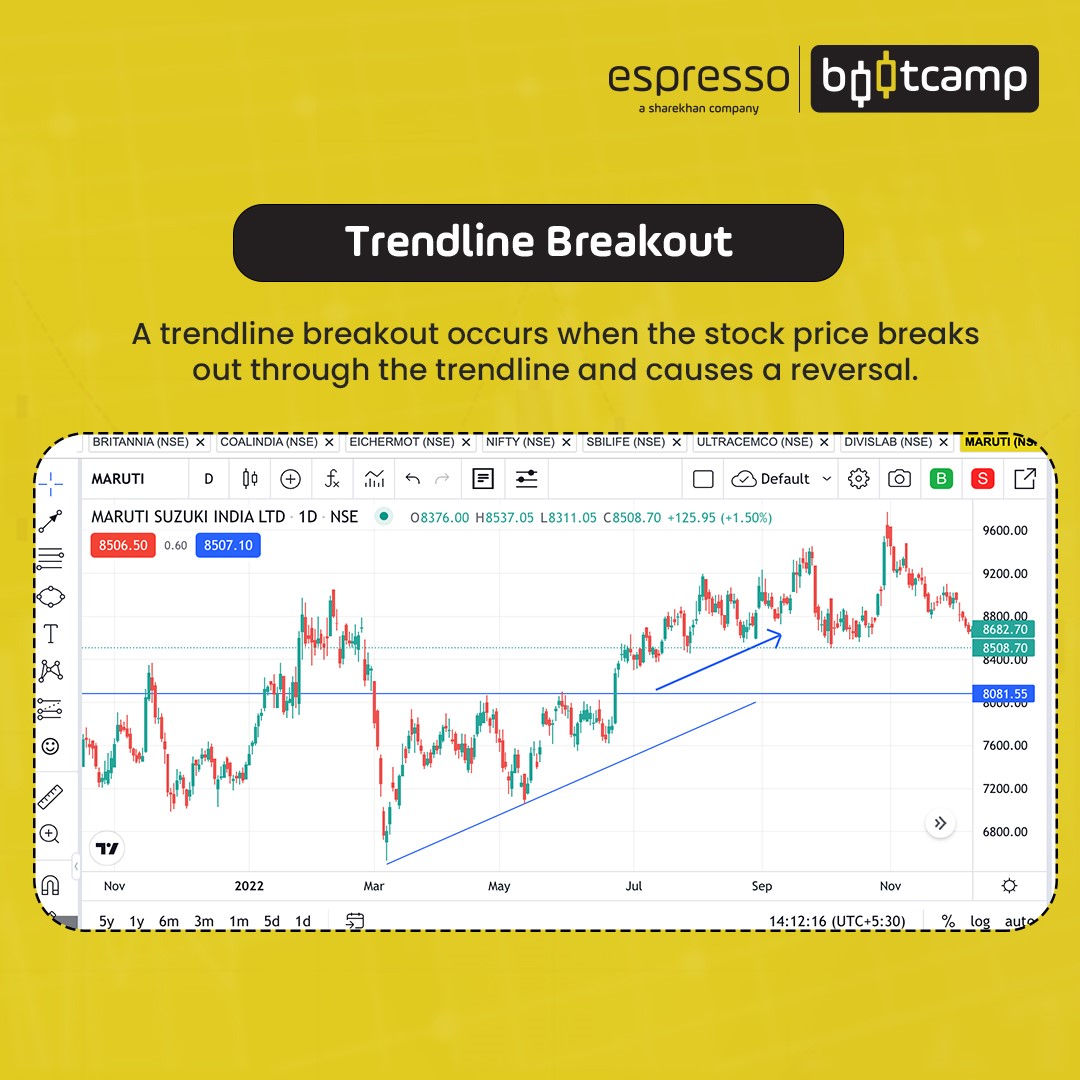
Many traders who use the breakout trading strategy often use technical analysis tools like trend lines to identify the key support and resistance levels. They also watch out for certain patterns in price movements which help them ascertain the levels where the prices have reversed their movements upwards or downwards on quite a few occasions. Trades essentially try to break those levels and move out but with little success, at least up to this point. Once the levels are successfully broken, traders can create their position with a view that the price will continue to move in the direction of the breakout.
Now, let's look at some breakout trading benefits, and some risks of breakout trading to keep in mind.
Identify the stock:
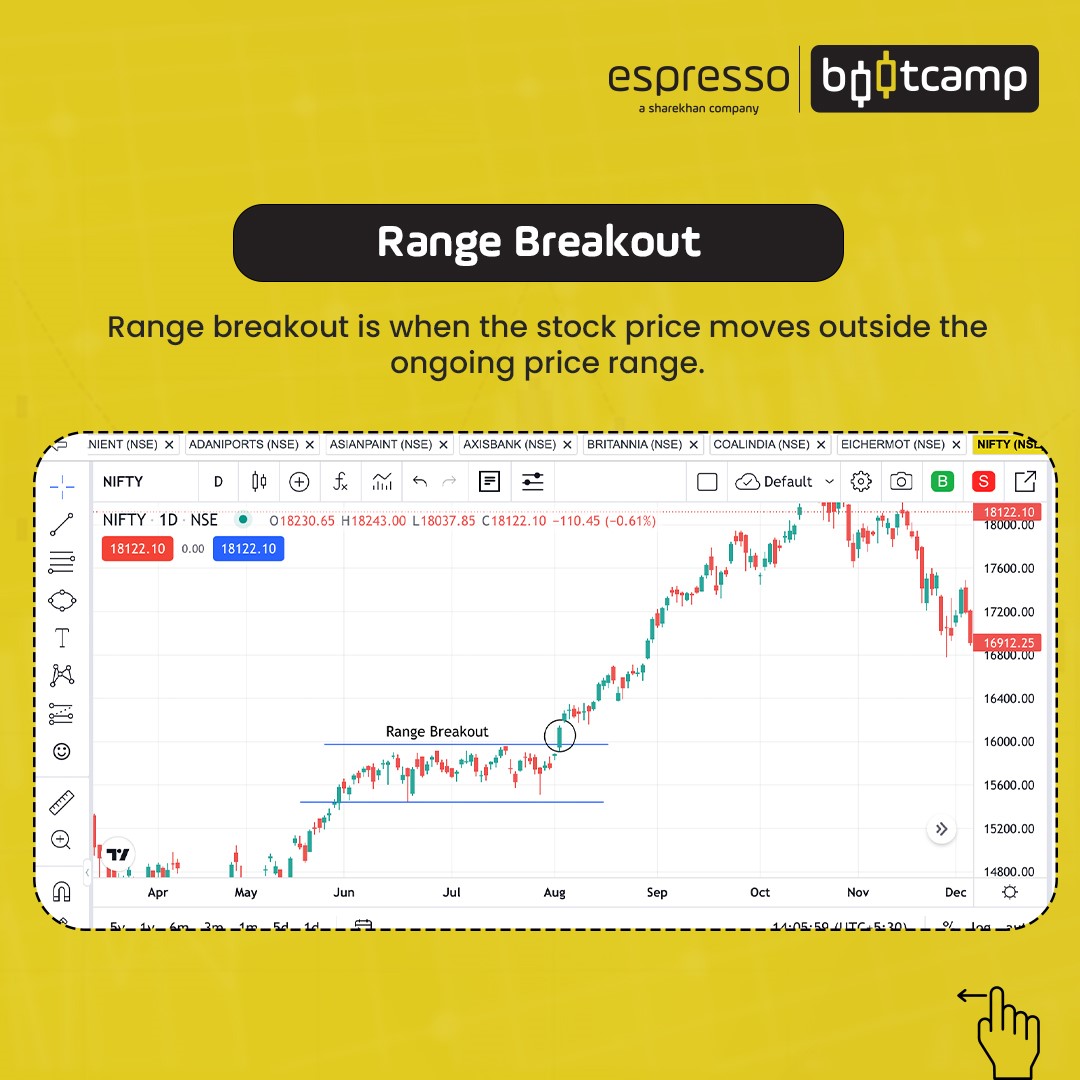
The first and most critical step is to identify the stocks that are gyrating in a range between the support and resistance levels for quite some time while being unable to break the shackles during this time. A close eye must be kept on the move, and the slightest signal of a possible breakout should trigger entry into the trade. The important point to note here is that the strength of the breakout move will depend a lot on how strong the support and resistance levels are. The stronger the support and resistance, the stronger will be the move.
Be clear about your expectations:
Controlling your greed is of utmost importance in stock trading, and this applies to breakout traders also. Traders must be clear about their exit price and the returns from a trade before they even enter it. Once the break-out happens and traders are able to create a position, they should come out of that trade upon reaching their pre-decided objectives. Whether you are using chart patterns or other technical tools, the objective must be set, failing which it will not be possible to exit at the correct price.
Retest the levels:
Retesting levels are also one of the most important points of breakout trading. It may be noted that once the stock moves past its resistance level, the old resistance becomes the new support level and conversely when a stock breaks a support level, the old support will become the new resistance level. Also, it is observed in a majority of cases that stocks will come back to the levels they have broken to retest them. This is when the traders should hold their nerves and not become impatient.
Failure of trade:
It is important to be strong and take the losses if the stock breaks back through the earlier support or resistance levels at the time of retesting. It is best to exit the trade if the original hypothesis of a breakout fails to stand true. Clinging on to a failing trade can aggravate your losses.
Patterns to look out for to enter into a breakout trade
Chart patterns:
Chart patterns are one of the most commonly used indicators in breakout trading. Cup & handle, channels, wedges, triangles, rectangles, and head & shoulders are some of the patterns that a breakout trader uses. The trader makes use of these patterns to draw trend lines and identify the support and resistance levels for a stock. Once the price moves out of this range, they enter the trade in the direction of the breakout.
Technical indicators:
Technical indicators work in the same or similar way as chart patterns. One of the most commonly used technical indicators, the RSI (relative strength index), may form a triangle on the price chart. This triangle can be used to identify when the breakout will happen and take position accordingly.
Use of business fundamentals:
Breakout traders also make use of the business fundamentals of companies to identify the potential breakout stock. For example, a company that has been declaring similar results for the past few quarters suddenly creates a flutter by declaring a surge in its earnings at the back of a new product launch, strategic tie-up, patents, etc. Such a company's stock becomes a potential candidate for a breakout trade as it has broken out of its old pattern.
Key takeaways
Breakout trading involves identifying a potential stock that has been stuck in a range, and whenever it moves beyond that range, it is important to ensure that there is a strong volume build-up with it before entering the trade.
As is the case with stock trading and all other trading strategies, it is very important to inculcate self-discipline in this strategy too. The breakout might fail frequently, and one must be ready to pay the price, but they must also know how to hold on to their winning trades and for how long because these winning trades can be the potential saviours to cover the losses made in the trades that failed.
Also, one limitation of this strategy is that it eliminates the possibility of trading the whole gamut of stocks that are already trending in either direction and holds the potential to generate healthy returns in a short time.
 0
|
0
|
 0
0

