
 Watch
Watch Stock prices do not remain stable always; they fluctuate, moving up and down, sometimes sharply, sometimes not so sharply. So what is the meaning of volatility? Volatility means wide price fluctuations.
Volatility meaning the rate of fluctuation of a stock over time. Volatility does not indicate the direction; it only tells how bouncy the stock prices have been in a particular period of time.  If a stock has been very bouncy, hitting new highs and lows in a relatively short time, it means it is a highly volatile stock. Conversely, if the stock is less bouncy, making fewer highs and lows in a relatively short period of time, it is said to be less volatile or of low volatility. It is imperative for an options trader to understand volatility to avoid unpleasant shocks.
Types of volatility
There are two types of volatility — historic volatility and implied volatility. Historic volatility is the daily fluctuation of a stock over a year. This does not indicate any direction. The stock can end up where it began at the end of the year and still be quite volatile. For example, consider a stock quoting at Rs 200 at the beginning of the year. During the year, the stock made several highs and lows, moving to Rs 210, Rs 230, Rs 190, Rs 185, Rs 170, Rs 240 and finally ending at Rs 205. This only shows that the stock has been very volatile without indicating any direction.
How to measure volatility?
The volatility of a stock is arrived at by calculating the standard deviation. Simply put, the standard deviation is the dispersion of the data from the mean value of the data. Standard deviation is stated as a percentage move in the price of an asset. If the standard deviation for the monthly return of Nifty is 10 per cent, then it means a one standard deviation move would mean the nifty would move either 10 per cent up or down in the next 12 months. For example, if Nifty is at 17000, then a one standard deviation move would be +1700 or -1700. The range, therefore would be 15300 -18700.
The daily closing price or the daily returns can be used as the data input. Therefore, standard deviation measures the deviation of the prices over a specific period from its mean or average price. Knowing the number of days is important because the lower the number of days, the greater would be the standard deviation, compared to the standard deviation calculated for a higher number of days. We can use closing prices or daily returns for calculating the standard deviation input. The standard deviation function is available in any spreadsheet application and can be easily calculated.
For example, we can calculate the daily returns for Nifty for a period and then arrive at the average daily returns. Then applying the standard deviation formula, we can get the daily standard deviation of the returns given by Nifty during the period. For monthly and yearly standard deviation, we have to multiply the daily average returns by the number of days, say 30 days for monthly, and 252 days for yearly. The result of this has to be multiplied by the square root of 30 and 252, respectively, to arrive at the standard deviation for monthly and yearly returns of the Nifty. The range of the Nifty would then be just addition and subtraction from the current Nifty price for the upper and lower range, respectively.
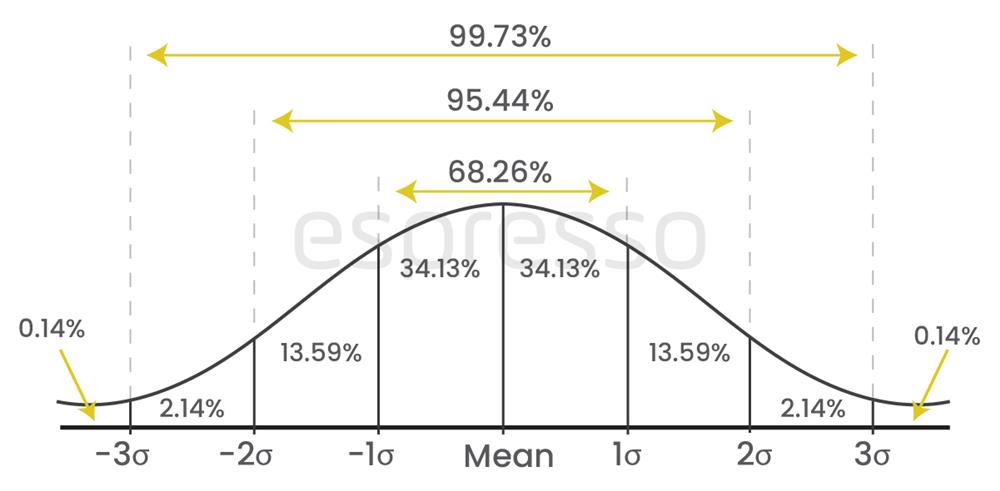 Once the daily returns are calculated, the frequency of the occurrences is plotted on a graph. This gives us the normal distribution curve or the bell curve, which is symmetrical with the deviations plus or minus formed on either side of the mean of the data. A bell curve based on empirical observations is divided into three parts; 1 standard deviation, 2 standard deviations and 3 standard deviations. About 68 per cent of the occurrence will fall in 1 standard deviation, while 95 per cent of the occurrences will fall in 2 standard deviations, and 99.7 per cent of the occurrences will fall in 3 standard deviations.
What this means is that the most probable outcomes are found near the mean of the curve, i.e., the centre of the curve, while the less probable or less frequent events like a black swan event or any other positive or negative news having a greater impact on price will be either a 2 standard deviations or a 3 standard deviations event. Historical volatility shows how volatile a stock has been based on past price movements. However, it has no direct relationship with options prices. For options prices, we need to look at implied volatility.
What is Implied volatility in options?
We know that option prices are derived from various inputs like underlying price, strike price, expiration interest rate, dividend and volatility. Excepting volatility, everything is easily available. The question is how to derive the price of an option. There are options pricing models that calculate the theoretical value of an option by taking the above inputs. One of the popular models is the Black-Scholes pricing model. However, this model assumes constant volatility and, therefore, fails to reflect the market sentiment. But since options prices are readily available, one can work out the implied volatility mathematically by using options prices as an input. But implied volatility is dynamic and drives the options prices up or down independent of stock price movements. One can see options prices gaining when earnings are declared, a court verdict is expected to be announced, during an annual budget or a Reserve Bank interest rate change is anticipated, among others. When implied volatility increases while other things remain unchanged, the options prices increase, and if it decreases, the options prices decrease.
Using implied volatility
Implied volatility is useful to identify the potential range of movement of a stock. For example, consider a stock is trading at Rs 100, and its implied volatility of an option is 10 per cent. This means that the stock can move up or down by 10 per cent in the next 12 months, i.e., it can go down to Rs 90 (100 – 10 percent of 100) or it can go up to Rs 110 (100 + 10 percent of 100). As per the empirical observations of the bell curve theory, there is a 68 per cent probability of the price ending between Rs 90 and Rs 110. This would also mean that there is a 32 per cent probability that the stock could go outside this range. One can plan a trading strategy accordingly.
Things to remember
- Volatility is the rate of fluctuation of the prices of a stock over a period of time. While volatility does not indicate the direction, it tells how bouncy the stock prices have been in a particular period of time.
- The volatility of a stock is arrived at by calculating the standard deviation.
- Volatility is of two types — historic volatility and implied volatility. Historic volatility is the daily fluctuation of a stock over a year. Implied volatility is dynamic and drives the options prices up or down independent of stock price movements.
- Implied volatility is useful to identify the potential range of movement of a stock.
 0
|
0
|
 0
0

