
 Watch
Watch Candlestick patterns with two candles
Now that we have seen single candlestick trend reversal patterns let’s look at what double stick patterns are or trend reversal in patterns that have two or more candles.
The most popular ones include:
- Bullish and bearish engulfing
- Bullish and bearish harami
- Dark-cloud cover
- Piercing pattern
- Tweezer tops & bottom patterns

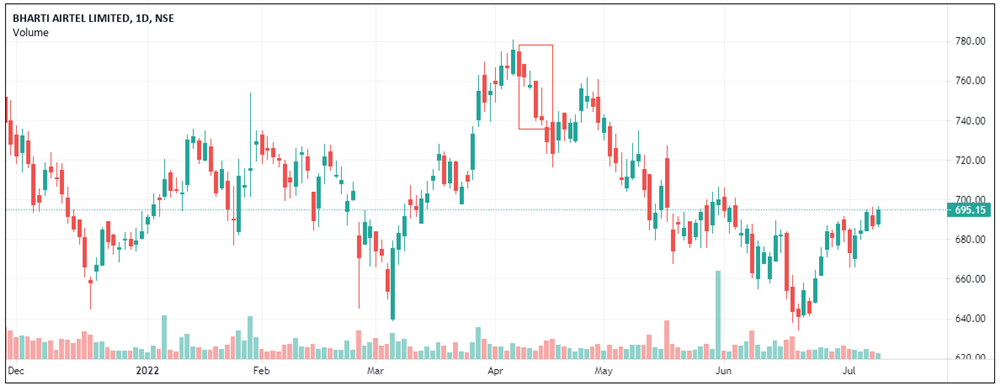
Bullish and bearish engulfing
The engulfing pattern is based on the real bodies of two opposite-coloured candlesticks. This is a major two-candlestick reversal pattern.
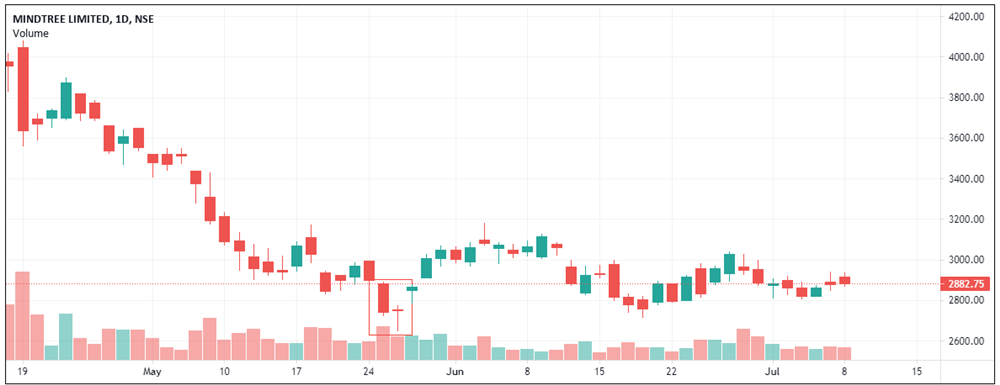
A bullish engulfing occurs when the market is in a clear downtrend, and the real body of a positive candle appears and engulfs the real body of the previous negative candle. This indicates that bulls have taken charge. (Study the chart below)
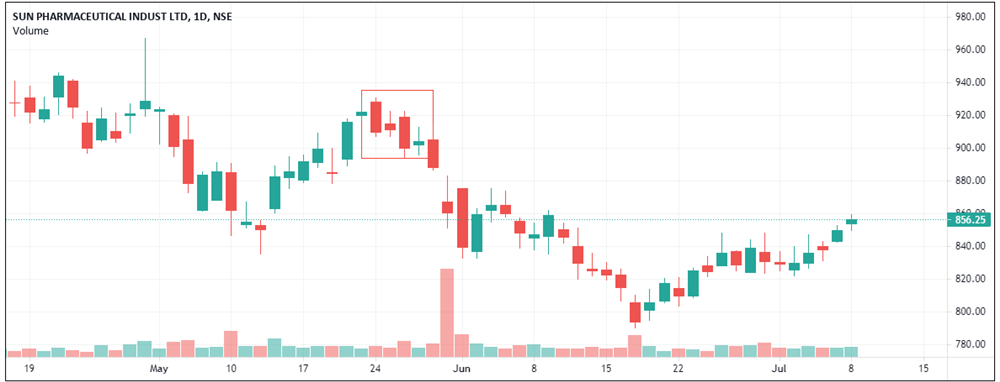
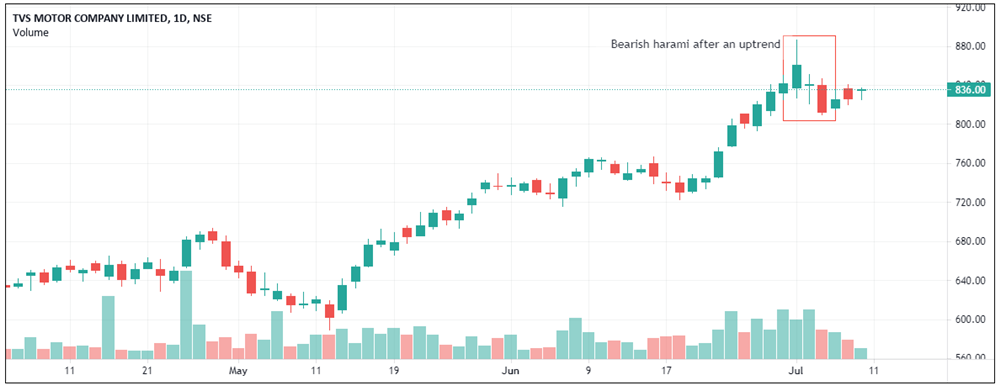
A bearish engulfing occurs when the market is in a clear uptrend, and the real body of a negative candle appears and engulfs the real body of the previous positive candle. The market mood change is indicated here from positive to negative. (Study the chart below)
A few points need to be mentioned for a strong reversal probability based on this pattern:
- The trend should be clear even though it is a small one.
- If the engulfing candle is accompanied by volume, it increases the chance of a reversal.
- If the candle engulfs more than one candle, it increases the probability of a trend reversal.
- If the real body of the previous candle is small and the engulfing candle is long, the move can be a powerful one.
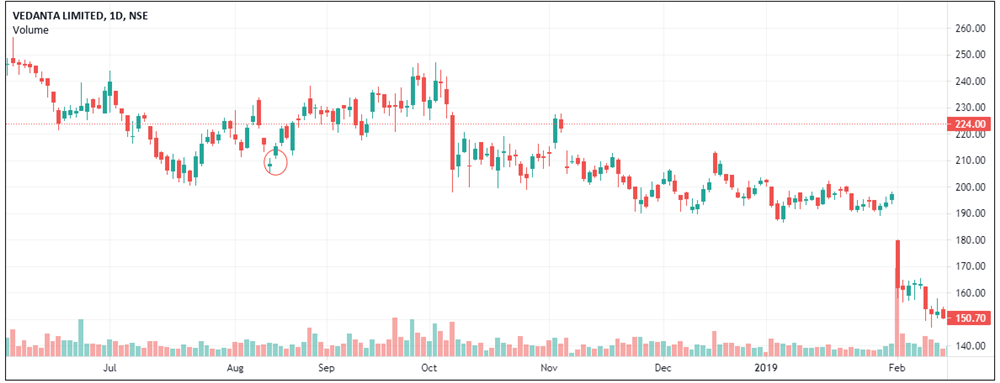
Bullish and bearish harami pattern
Harami is the Japanese word for pregnant. This pattern has a small body, which is contained by a previous relatively long candle.
- The previous candle, the longer one, depicts the mother.
- The small candle, which is within the real body of the previous candle, is the baby.
- The colour of the small candle is not important.
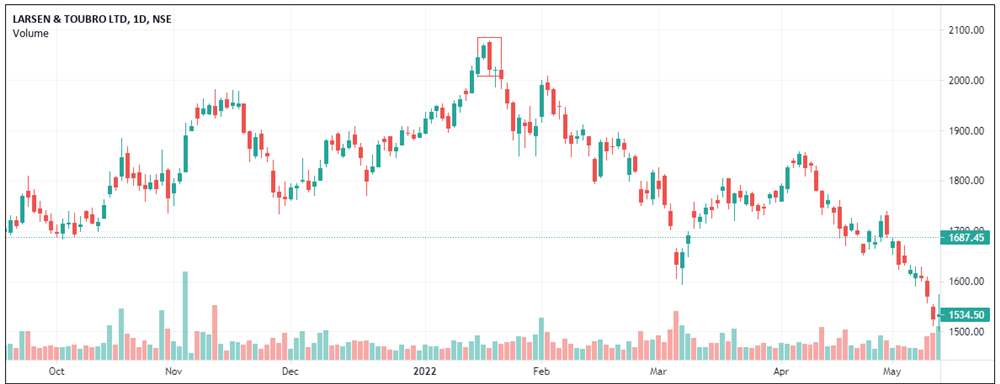
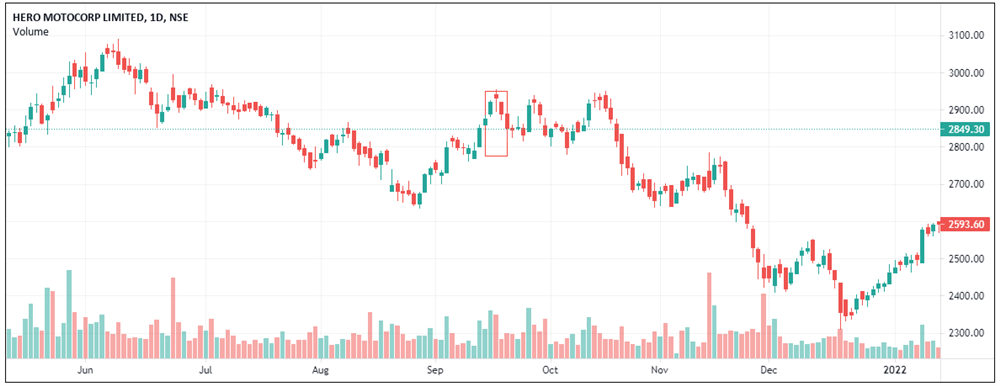
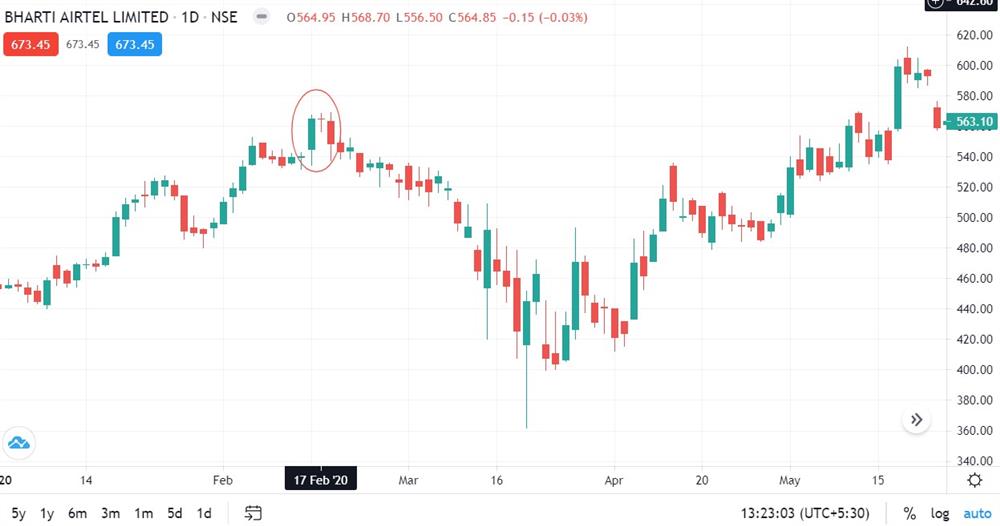
- If this pattern occurs after an uptrend within a long positive candle, it is a top reversal. (Study the chart below)
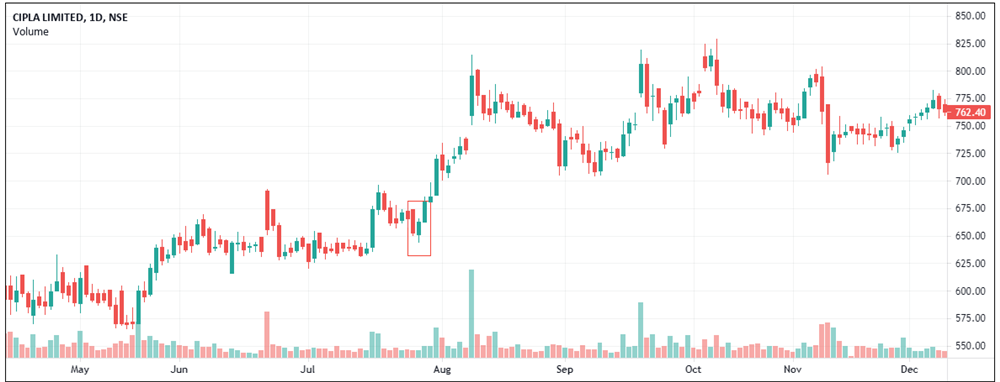
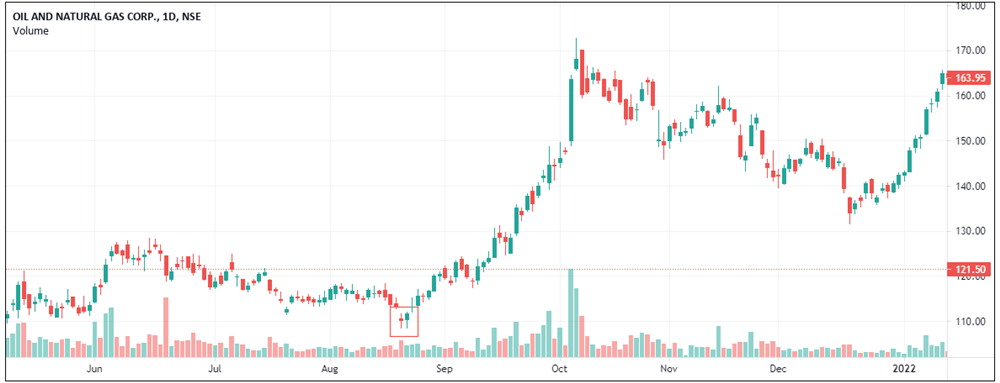
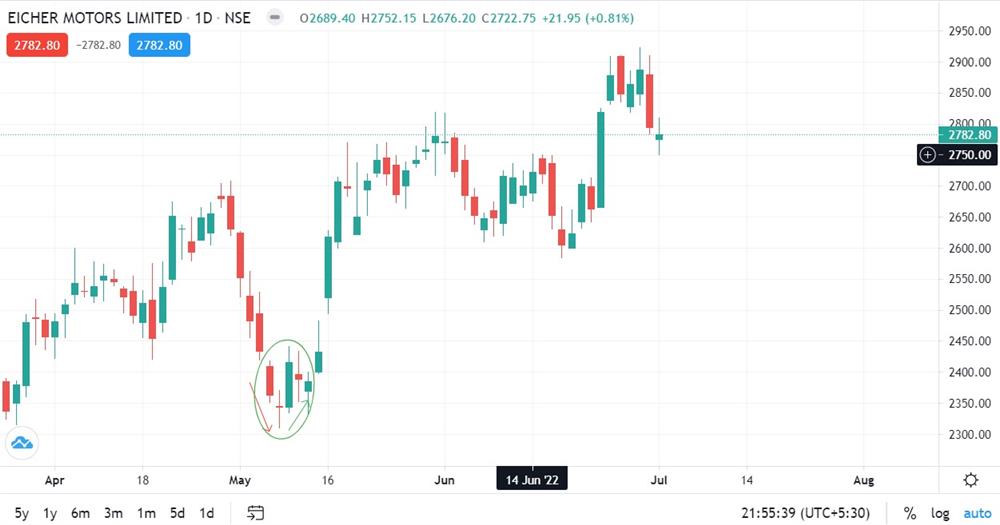
If it occurs after a downtrend within a negative long candle, it is a bottom reversal. (Study the chart below)
- A harami cross pattern is an exact opposite of an engulfing pattern.
- Even though this pattern is not considered to be a reversal pattern, a harami cross is considered to be a major reversal pattern.
- A harami cross is a pattern where the small body is a Doji that is contained within a long positive or a long negative candle.
- It can appear after an uptrend to form a reversal down and in a downtrend to form a reversal up. (Study the charts below)

Dark-cloud cover
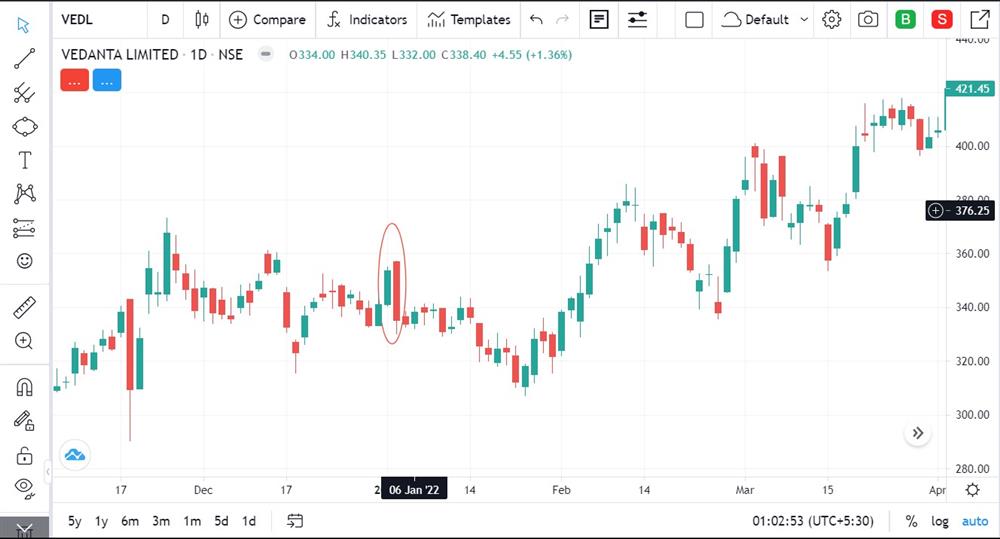
Dark-cloud cover is a reversal pattern that appears at the top of an uptrend. It’s a two opposite coloured pattern that has a long positive candle followed by a negative long candle. The negative long candle opens above the positive candle’s high but fails to sustain and ends up closing at the low of the day - but within the positive candle's body.
Points to be noted:
- If on the black-cloud day, when the opening was above the previous positive candle’s high is accompanied by volume, and later on there is a sell-off, then it is highly probable that it is a reversal.
- If the same thing happens above major resistance and there is a sell-off, the result is going to be similar. (Study the chart below)
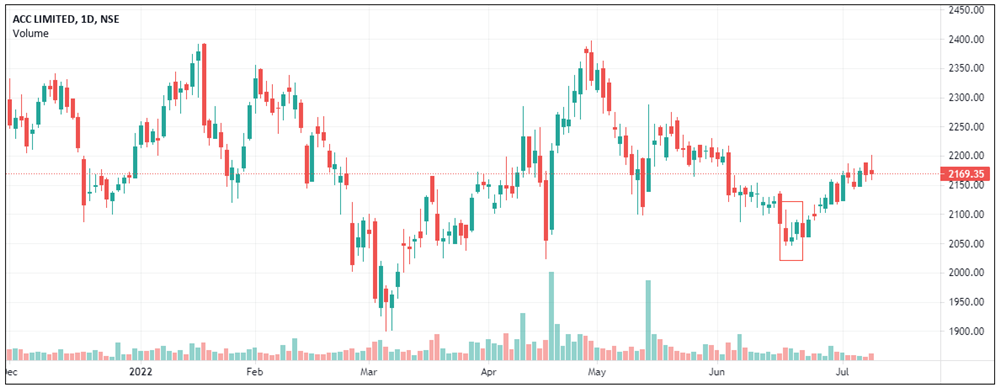
Piercing pattern
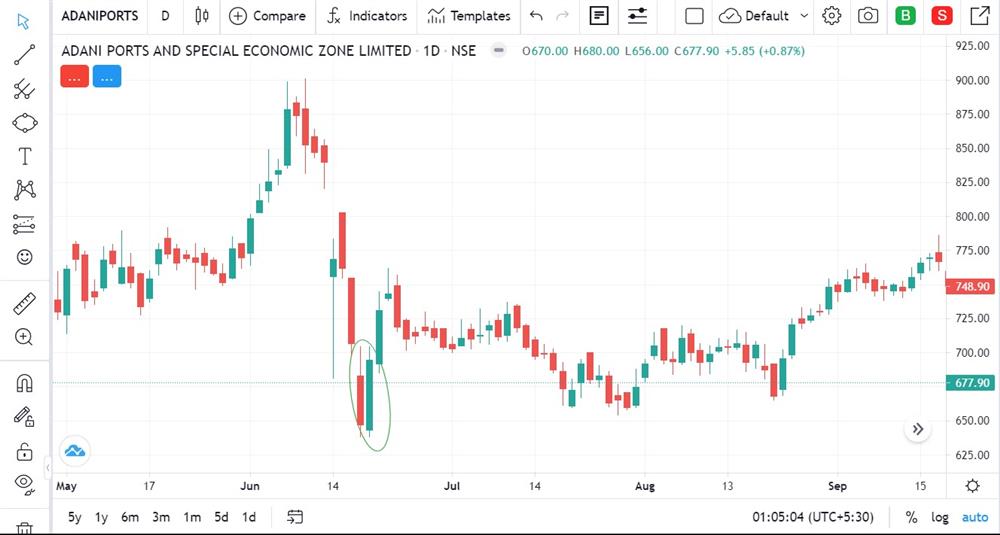
This pattern is the opposite of dark-cloud pattern, signalling a reversal at the bottom of a downtrend. In this two-candle pattern, the first candle is a negative candle with a real body, while the second candle is a real body long positive candle that pierces the negative candle and closes above the mid-point of the negative candle.
This is a likely reversal pattern as the real body-long positive candle has arrested the bearish trend. Greater the piercing of the negative, the better the chances of reversal. (Study the chart below)
Tweezer tops and bottoms
Tweezers are two candlestick patterns where either the highs or lows are the same. In an uptrend or a rising market, when the highs match, it is known as a tweezer top. (Study the chart below)

And, in a downtrend or falling market, when the lows match, it is known as a tweezer bottom. (Study the chart below)
- Tweezers can be real bodies, shadows and Dojis.
- The important point here is it need not be the next candle.
- A tweezer occurring with a bullish candle pattern at the top or a bearish candle pattern at the bottom exhibits better possibilities of reversals.
- A tweezer that works well in the weekly and monthly timeframe made by a consecutive candle can present a high probability reversal.
Candlestick pattern with three candles
Stars are the most popular triple candle pattern. The star pattern comprises a long real body, a star that gaps away from the real body and a long real body after the star moves within the real body of the first long candle. The colour of the star is not important. A pattern can be qualified as a star even if it does not gap away. However, it must not overlap the real body of the prior candle.
Below are some examples of this pattern:
Morning and evening star
Morning star pattern appears after a downtrend. This pattern is made up of a long real body candle followed by a small real body that gaps down the previous candle. The next candle, i.e., the third candle, is a bullish real body candle that moves upward and within the real body of the first candle.
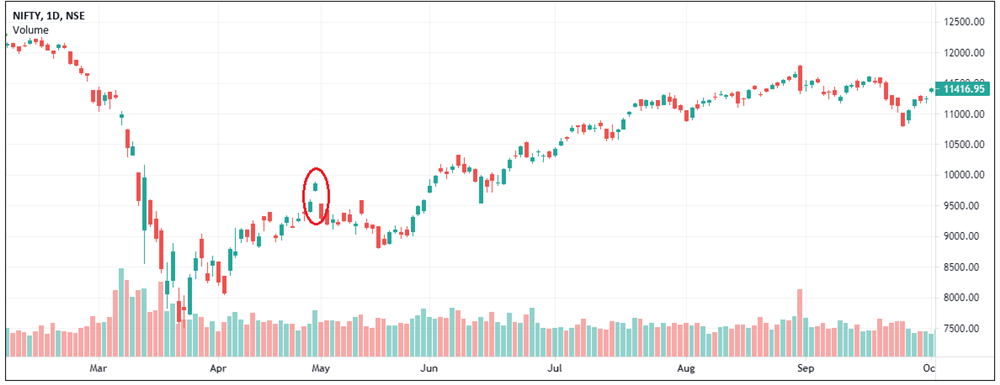
This three-candle pattern indicates that the bears are exhausted, and the bulls have taken control. (Study the chart below)
The evening star pattern is the exact opposite of the morning star pattern. This pattern appears after an uptrend. This pattern is made up of a long real body positive candle followed by a small real body candle that gaps away from the long candle. Thereafter, a long bearish real body candle appears as a third candle that moves within the first candle, indicating the bears have taken over. (Study the chart below)
The morning and evening Doji star
We have already seen what a Doji is. A Doji star is a pattern where the reversal can be even stronger. It’s a pattern when a Doji gaps up or gaps down a real body-long candle to form a bearish or bullish reversal.
A Doji star at an uptrend can be a signal of a top being formed. This is known as the evening Doji star pattern. (Study the chart below)
A Doji star in a downtrend can be a signal for a bottom being formed. This is known as a morning Doji star. (Study the chart below)
Since this is a three-candle pattern, one must always be careful to watch the immediate candle after the Doji star to confirm the reversal. For example, if a Doji star appears in an uptrend with a potential reversal and the candle next to it is a long positive candle gapping up instead of gapping down, then this pattern is void. This holds for the Doji star appearing at the bottom as well.
Abandoned baby
In this pattern, if a Doji star is formed after a gap up in an uptrend, and the next candle is negative and it gaps down, it is known as an uptrend abandoned baby. (Study the chart below)
Similarly, in a downtrend gap-down Doji star, the next candle is a positive candle that gaps up then the pattern is known as downtrend abandoned baby. An abandoned baby is a rare occurrence, however, if it does happen, there is a high probability reversal. (Study the chart below)
Shooting star and inverted hammer
Shooting star is a pattern that occurs when a stock has rallied and has reached its top, signalling a reversal. A shooting star is characterised by a small body at the lower end with a long upper shadow. This pattern suggests that the price opened near the low, and thereafter rallied upwards, and finally came back to close near the opening. Here, the position of the candle is important, not the colour. It signals a reversal of an uptrend. (Study the chart below)
The shooting star pattern in a downtrend is known as an inverted hammer. However, unlike the shooting star, the inverted hammer needs confirmation as, by nature, a shooting star is a bearish candle, and if it appears at the end of a downtrend, it needs to be verified. If the next day, the next candle opens above the inverted hammer, the traders who were short at the inverted hammer would be trapped, and there will be short covering leading the rally. Also Read about the Inverted Hammer Candlestick Pattern
Points to remember:
- Multiple candlestick patterns can indicate trend reversal or continuation.
- In the case of a three-candlestick pattern, a trader should always wait for the third candle to form in order to get confirmation.
 0
|
0
|
 0
0

