
 Watch
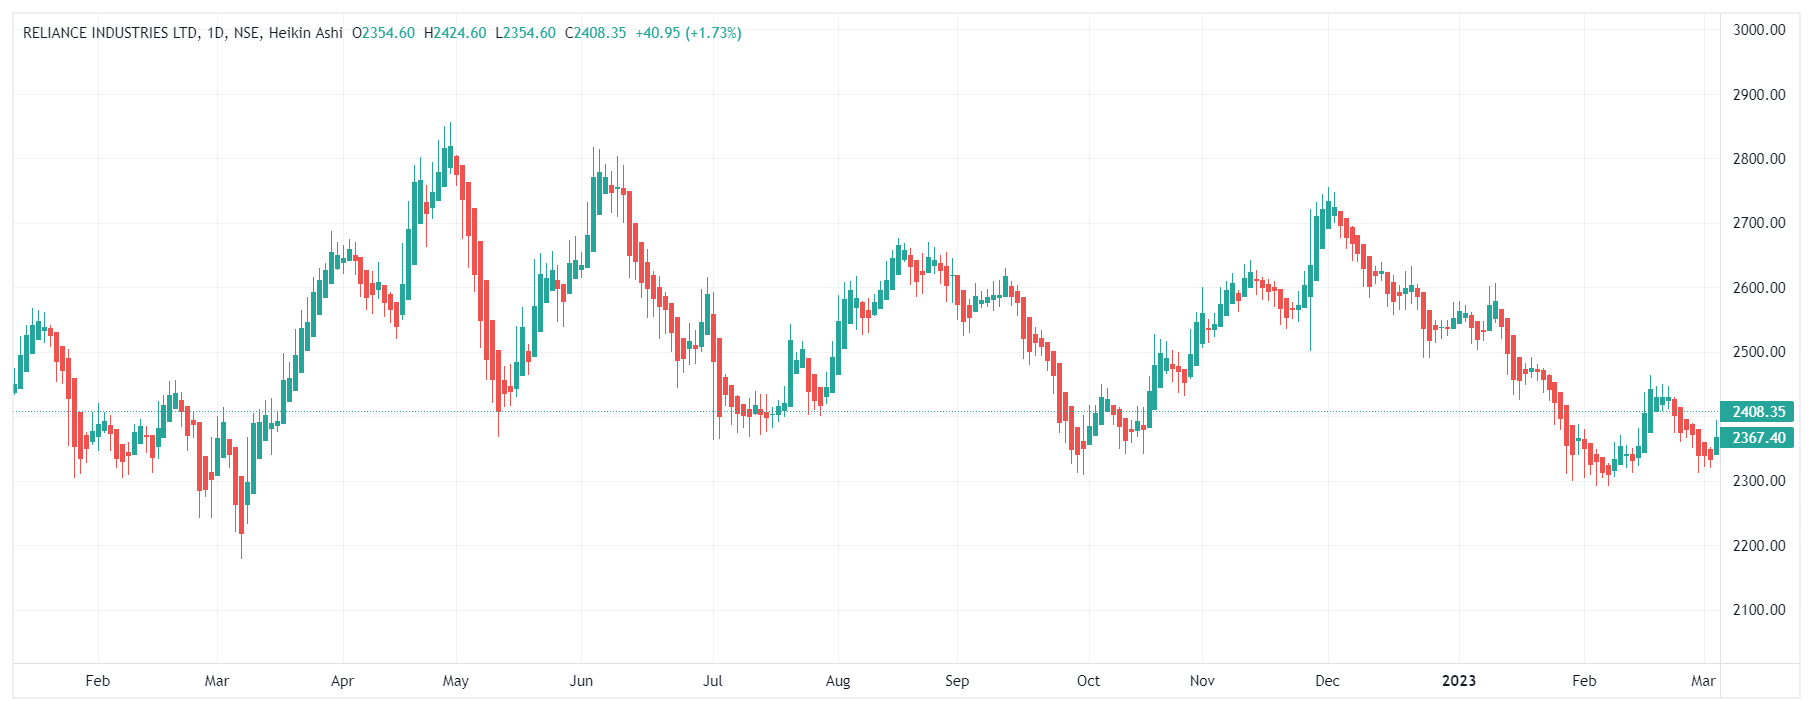
Watch By now, you must have gathered that Heikin-Ashi is also a Japanese term. It means ‘average bar’, and the technique is based on the principle of averaging price data to create a Japanese candlestick chart that filters away noise created by volatility.
As you’ve gathered from previous chapters, noise generally hides genuine underlying market trends and the reasons driving them. Noise also makes it difficult to identify if the trend is actually changing or experiencing the impact of volatility.
Developed by Munehisa Homma in the 1700s, these charts are somewhat similar to standard candlestick charts. The difference lies in the methodology of creating each candle. This technique uses a modified formula that is based on two-period moving averages instead of the normal open, high, low, and close prices used in the standard charts.
What are Heikin-Ashi charts?

- Heikin-Ashi charts in technical analysis make use of the open-close data of the prior period and the open-high-low-close data of the present period.
- A combination of candlesticks is created that filters out noise in an effort to capture the trend better.
- The technique generates a smoother chart that obscures gaps and some price data, which makes it easier to spot trends and reversals.
How to calculate them
To make the Heiken-Ashi chart, we use the open-high-low-close (OHLC) from the current period and open-close data from the prior period. The formula for calculations is as given below:
- Heiken-Ashi close = (Open+High+Low+Close)/4, which is simply the average price of the current period bar
- Heiken-Ashi open = (Open+Close)/2, which is the average of open of the prior Heiken-Ashi candlestick and the close of the prior Heikin-Ashi candlestick
- Heiken-Ashi high = Maximum of the three data points (the current period’s high, the current Heiken Ashi candlestick open and the current Heiken-Ashi candlestick close)
- Heiken-Ashi low = Minimum of the three data points (the current period’s low, the current Heiken-Ashi candlestick open and the current Heiken-Ashi candlestick close)
How to climb the first step
- To prepare the first Heiken-Ashi chart, we need to use data from the current open, high, low and close.
- The first Heikin-Ashi close is the average of the open, high, low and close ((O+H+L+C)/4).
- The first Heikin-Ashi open is the average of the open and close ((O+C)/2).
- We need to use the high as the first Heiken-Ashi high and the low as the first Heiken-Ashi low.
- Though this first candlestick does not seem to represent a correct picture, the effects of variances tend to go away over a period of seven to 10 candlesticks.
How to read Heiken-Ashi charts
Heiken-Ashi charts in stock market provide five primary signals that can be applied to identify trends or buying and selling opportunities. They are:
- Hollow and green candles with no lower shadows indicate a strong uptrend and one should remain invested in the trade
- Hollow and green candles also signify an uptrend and investors might add to their long position and exit their short trades
- Trend change is indicated by candles with a small body surrounded by upper and lower shadows. Doji candlestick is one such example. Investors should wait for another signal before going long or short at this point, even though investors with high risk appetite may jump to buy or sell at this point
- Downtrend is indicated by filled or red colour candles, and traders should exit their long positions and build on their short positions
- Absence of higher shadows on filled or red candles indicates a strong downtrend. Traders should remain short during this period
In the Heiken-Ashi technique, the signal indicators are considered credible and have a strong success rate. Traders can use these indicators to ride the trend profitably.
The emergence of candlesticks without tails is a strong indicator of a bullish trend. The longer the sequence, the stronger will be the upward move. Conversely, the emergence of candles with no upper shadows is a strong indicator of the emergence of a downward trend.
Traders, however, should exercise caution and wait for confirmation of trend reversal when candles like Doji emerge. They may indicate a pause in the trend and not the actual reversal of the trend. Waiting for a signal of confirmation is always required in such instances.
Benefits of Heiken-Ashi charts
Easy to interpret: Any trader with a basic knowledge of candlesticks will be able to identify the trend indicated by these charts
Credible: The charts have a high success rate in providing accurate results. The fact that they use historical data also adds to the credibility and accuracy of the results
Cuts out market noise: Since these charts filter out market noise and small corrections, it becomes easier to identify the underlying trend and make entry and exit decisions accordingly
Acceptability: These charts are part of all trading platforms and do not require any purchase or installation Easy to combine with other technical indicators: This factor helps provide much stronger signals about the market movements
Drawbacks of Heiken-Ashi Charts
Use of averages: Heiken-Ashi charts use averages of prices and do not show actual open or close prices. Some price data is lost with averaging and, therefore, may not be helpful to all categories of traders, such as scalpers or day traders.
Absence of price gaps: Some traders use price gaps to identify price momentum, trigger points or stop losses. Their absence makes it difficult to identify these trends, for which the traders have to use a combination of Heiken-Ashi and other chart patterns.
Trade setup takes longer to develop: The use of price information of two periods makes the trade setup longer to develop, which though is helpful for swing traders, may not be helpful for day traders as they may miss on some quick moves.
Points to remember
- Heiken-Ashi charts are easy to interpret and help identify the underlying trends without getting into the complexities of other technical analysis tools.
- These charts provide traders with the flexibility to apply all aspects of traditional/classical technical analysis.
- Apart from identifying the support and resistance levels, drawing trendlines, and using momentum oscillators, this brings out the trends more effectively.
 0
|
0
|
 0
0

