
 Watch
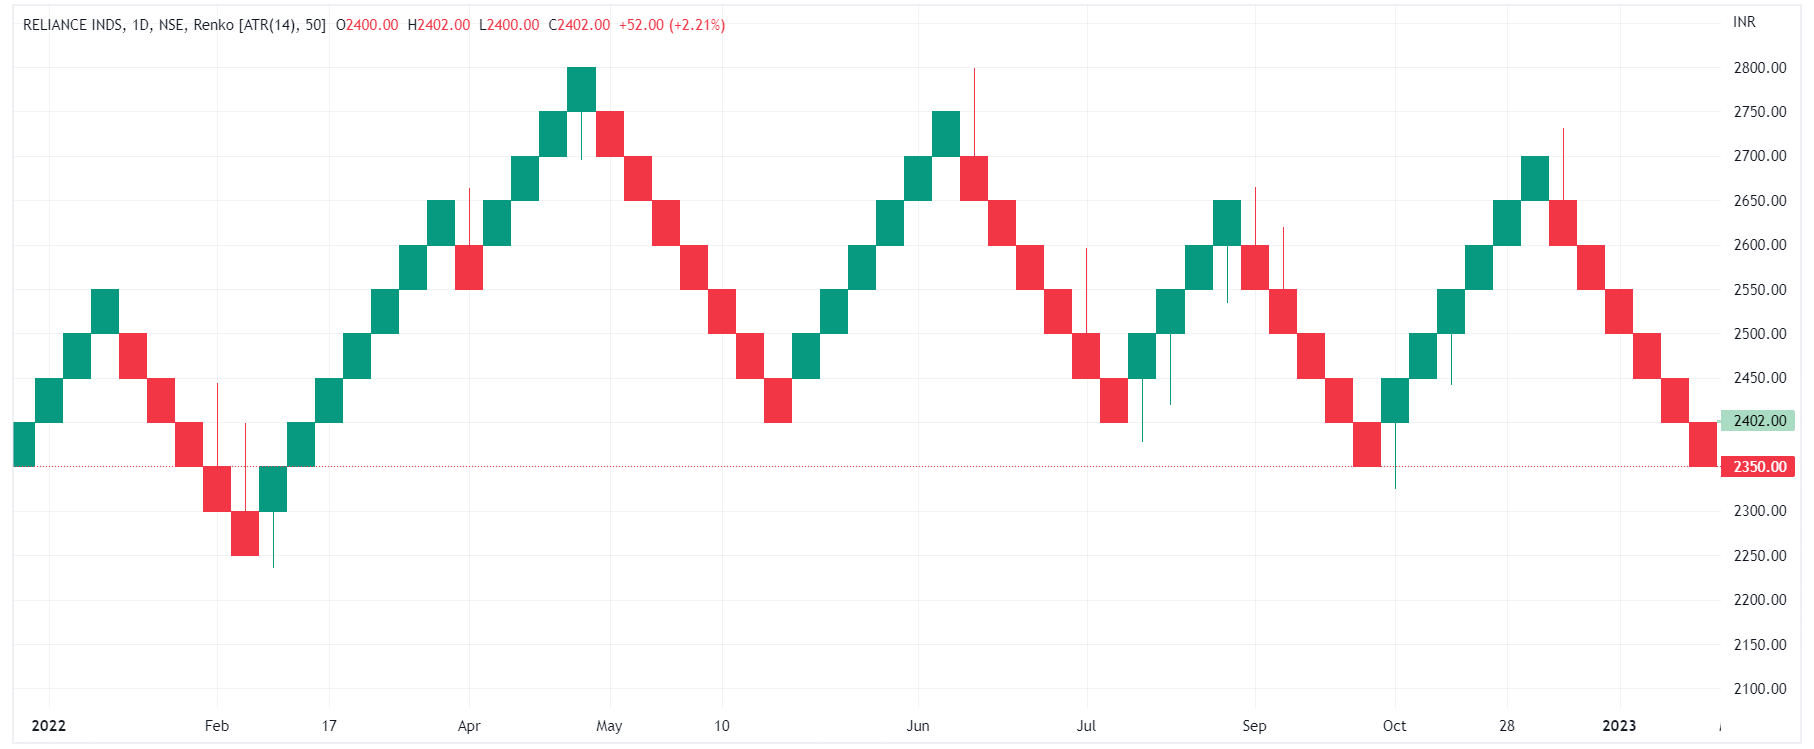
Watch Renko charts were developed by the Japanese almost 200 years ago. These charts derive their name from the Japanese word ‘renga’, which means bricks.

- Renko charts look like a series of bricks.
- They are placed together either up or down at a 45-degree angle to the previous brick based on the increase or decrease in price movement.
- No two bricks appear beside each other.
- The colour scheme used for the bricks is usually white or green for upward price movement and black or red for downward movement Renko charts are popular among professional traders to chart out their trading strategies and identify trends. A unique feature of the Renko charts in stock market is they are prepared using only price movements as compared to both price and time movements that are more commonly used in other charts.
How to create Renko charts
From what we have gathered, the Renko indicator make use of bricks. The bricks can be set for any size, such as Re 1, Rs 2, Rs 5, Rs 10, Rs 50 and so forth. However, brick is only formed or gets displayed on a chart once the price has moved by the amount set for each brick.
Since these charts do not take into consideration the effect of time, the formation of brick is dependent only on price movement and does away with price movement in a specified time range. The formation of brick depends on the volatility of the stock and the size of the brick set by the trader initially.
Let us understand this more clearly.
If a brick size is set as Rs 5 and the stock is currently trading at Rs 50, the next brick will be formed only when the stock price reaches and closes higher than Rs 55, or moves down and closes below Rs 45.
If the stock touches Rs 54.95 and retreats, a new brick will not be formed. Similarly, only if the price moves and closes beyond Rs 60 the next brick will be drawn.
Also, since the bricks are not drawn next to each other, if the price drops back to Rs 55, a new brick will not be drawn. The price has to fall back and close below Rs 50 for a downward brick to appear below the prior upward brick.
How to use Renko charts
Just like Heiken-Ashi (as you know from the last chapter), Renko charts also filter out the unwanted noise as all the price movements smaller than the brick sizes are filtered out, and the underlying trend comes out more strongly and clearly.
Indicator: It may be noted that Renko charts make use only of the closing prices for a chosen time frame rather than the opens, highs or lows considered in other charts. A daily time frame, if selected, considers daily closing prices, a weekly time frame will make use of weekly closing prices and so on.
Size: A lot depends on the brick size selected by the trader, as it will impact the overall smoothness of the chart and its trends. A small brick size will result in more swings and will be able to capture the possible price reversals earlier. Conversely, a larger brick size will iron out the noise of small price fluctuations and will reduce the number of swings. However, the flipside will be that a larger brick size will be slow in giving the signal of price reversal.
How to enter/exit a trade using Renko charts
In simple terms, the appearance of a green brick indicates an entry, while the formation of a red brick signals an exit. However, a more refined and smart way would be to use a 13-period exponential moving average (EMA) on Renko charts to trigger an entry.
Traders should use the formation of the second green brick above the 13-period EMA in continuation to the first green brick above the 13-period EMA to enter the trade. Similarly, the formation of second red bricks below the 13 EMA will signal an exit.
Renko charts are also more accurate in finding support and resistance levels and breakouts and reversals as they filter out more noise as compared to traditional candlestick charts. This enables traders to ride the underlying trend for a longer time when the brick in the opposite direction is finally formed.
Advantages of Renko charts
Just like Haiken-Ashi charts, Renko charts filter the market noise to give smooth trends by focusing solely on the price of a stock. They do not consider the impact of time on the movement. They are quite accurate in identifying the support and resistance levels as well as trend movements.
They provide a long and broader view of the markets and are useful in the case of mutual funds that make use of closing NAVs.
Drawbacks of Renko charts
The major drawback of using these charts appears from the fact that they completely do away with the factor of time. A stock may remain in a tight price range over a long period of time, maybe days or weeks, and that will be represented only as a single brick on the chart without giving any information about what happened with the stock during that time frame.
These charts also consider only the closing prices rather than the highs and lows. This hides the important price movements, as there may be a lot of price movements between the highs and lows. Also, the noise may get ironed out, but the price may move suddenly before the new brick is formed, leading to traders completely missing out on price movement.
Experts suggest traders use stop-loss orders while using these charts so that they do not end up with losses due to sudden price movements.
Points to remember
- Renko charts filter out unwanted noise by focusing only on price changes.
- They help identify important support and resistance levels as well as key highs and lows, as the bricks are not formed unless the price moves by the amount decided initially while setting the size of the brick.
- These charts help traders identify upward trends by reflecting the higher highs and higher lows, and vice versa for downward trends.
- As a precaution, however, traders should use other technical analysis tools to confirm the trends suggested by the Renko charts to gain a comfort level.
 0
|
0
|
 0
0

