
 Watch
Watch When demand for a product is greater than supply, the price of that product goes up and conversely, when supply is greater than demand, the price of that product declines. This general rule is also applicable in the stock markets as the supply and demand of individual stocks play a great role in determining stock prices. Thus, to gauge the true sense of the market, it’s not just the amount by which the stock price has gone up or down, but also one needs to consider the accompanying volume of the particular stock on a given day.
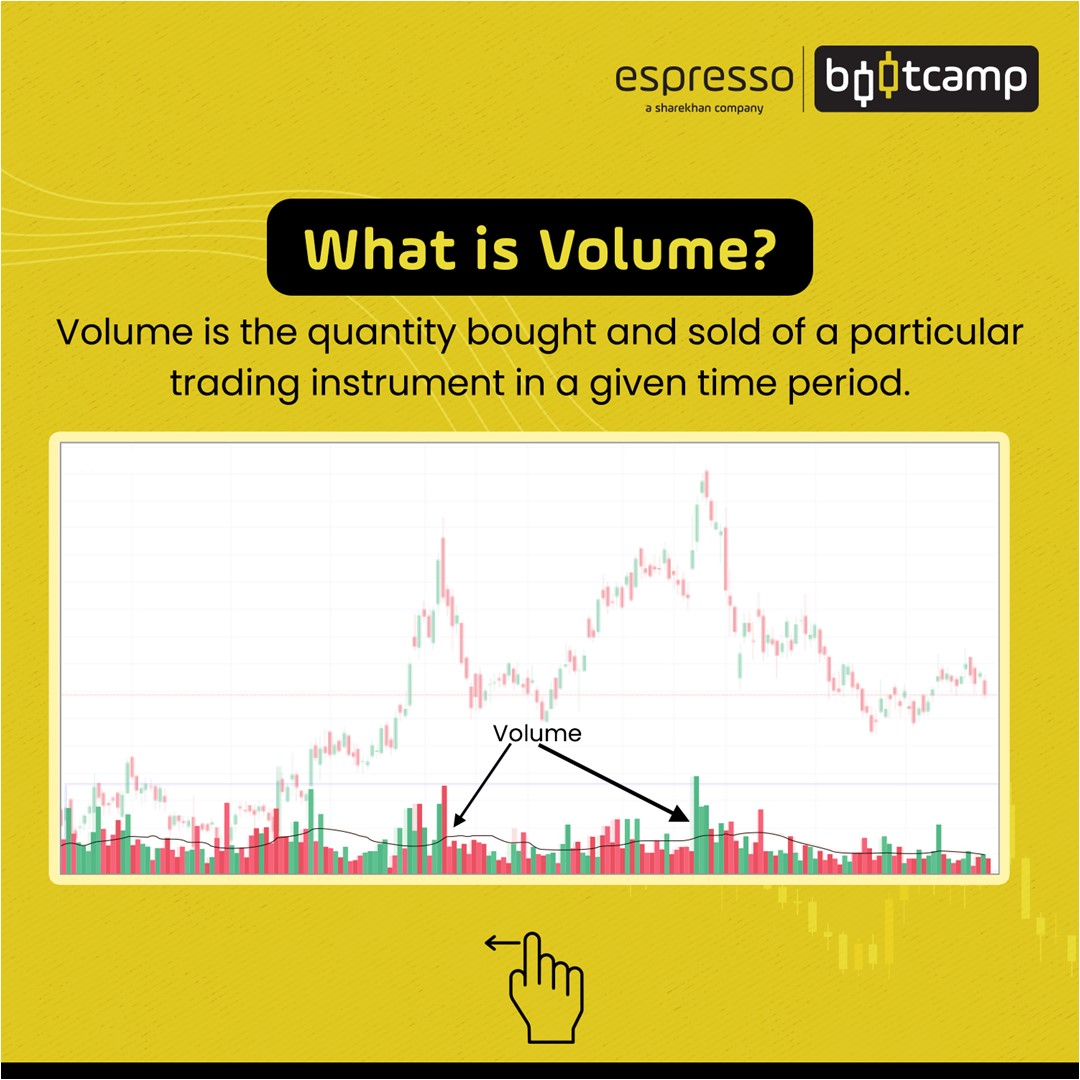
Volume is nothing but the number of shares traded, that is, bought and sold, in a trading session. When the stock price closes above the previous day’s close, the resultant volume is up-volume, meaning there was buying interest in the stock. On the other hand, if the stock price closes below the previous day’s close, the resultant volume is down-volume, meaning sellers had the upper hand during the day. In real-time, if the buyer buys at the offer price, it’s a bullish signal and a series of such transactions will eventually push up the price of the stock. On the other hand, if the seller of the stock sells at the bid price, it indicates desperation to sell which is a negative signal, and a series of such trades may pull down the stock price eventually.
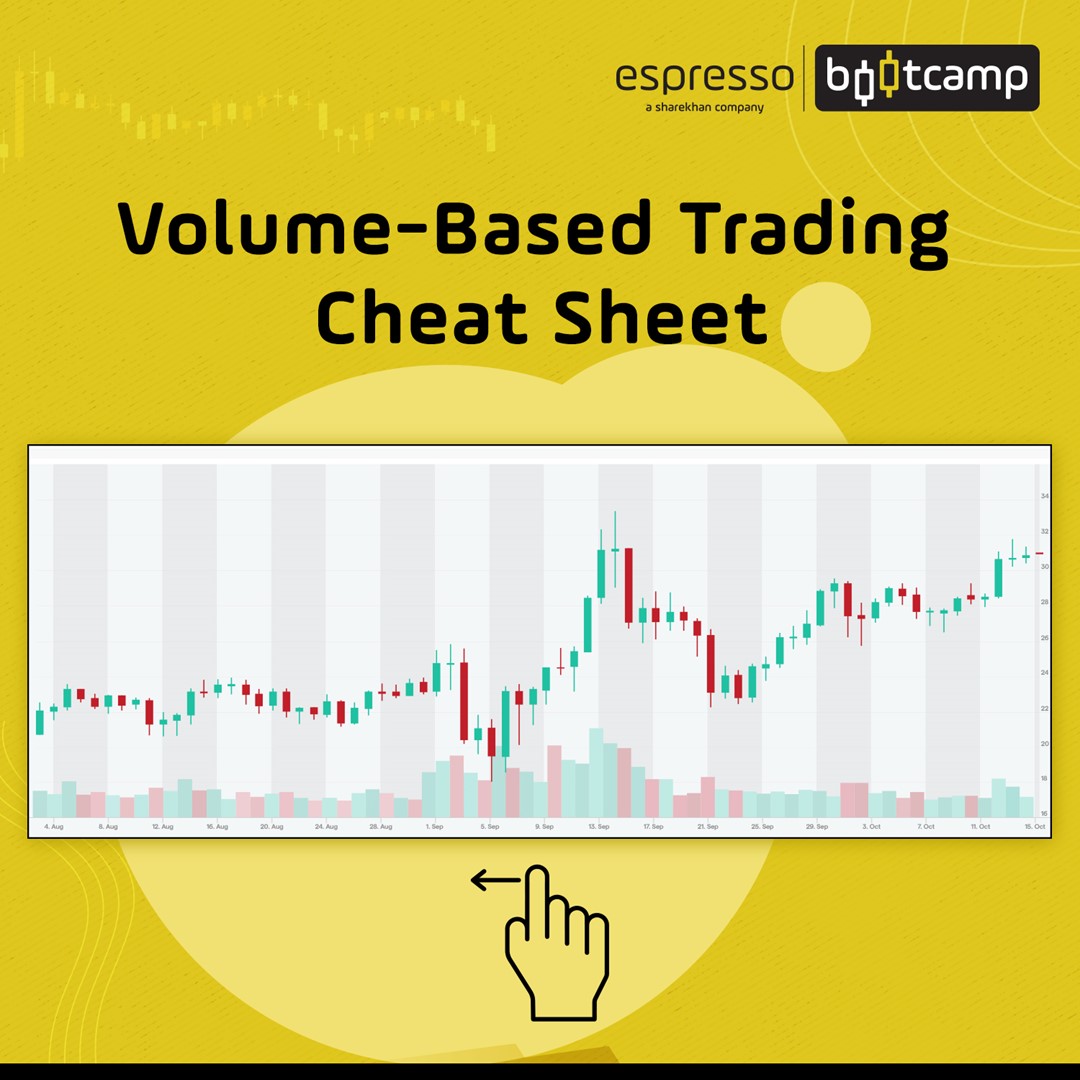
Volume usually appears at the bottom of a stock price chart as vertical bars that indicate how many shares are traded in a given session.
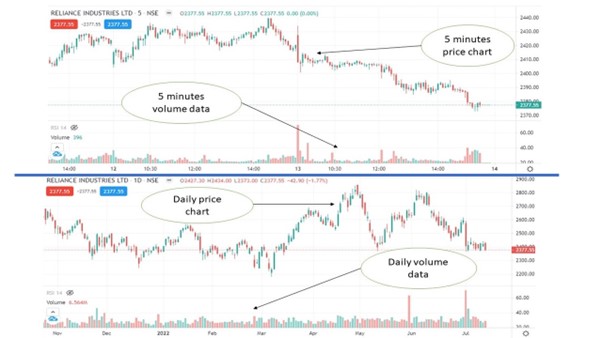
Given above is the price and volume chart of Reliance Industries for both daily and 5-minute time periods. Just as the price chart has red and green candles, volume data, too, has red and green coloured bars. It should be noted that these bars will have the same colour as the corresponding candles in the price chart. The red bar indicates down volume while the green bar indicates up-volume.
In the case of an index, say Nifty 50, spot market volume data will not be available as no trades of indices take place on the spot market. In the case of an index, it’s the number of buying and selling contracts of futures or options that act as volume. It should be noted that in the case of derivatives, it’s usually the volume of open interest rather than the concluded deals (trading volume) that carry more value in determining the trader’s interest in stock or index. Open interest is the number of contracts in options and futures contracts that are active or not settled for an asset at a given point in time. Open interest increases when new contracts are added and decreases when existing contracts are settled.
Liquidity: Liquidity is an important issue for traders and large investors. High liquidity ensures that a trader/investor can enter/exit a stock or derivative without much affecting the stock price. In the absence of liquidity, a large investor may not be able to enter a stock without pushing up the stock price. Similarly, on a downtrend, an investor who wants to dispose of his large holdings may not be able to do so without pushing the stock price further down. Technical analysts often use volume data in trend and pattern analysis.
Continuation of trend
When the stock is in an uptrend, and the volume starts rising, it shows that more and more people (investors/traders) are getting interested in the stock, which will ensure the continuation of an uptrend. Similarly, if the stock is on a downtrend and the volume is also increasing it signals that the downtrend will continue. Trend reversal signals
If the rising or falling stock price is accompanied by declining volume, it’s a clear signal of waning interest of the buyers/sellers in stock and signals a trend reversal is in the offing. Sometimes such trend reversals may also result in sideways movement.
An ideal pullback, i.e., a movement against a trend, is one that is accompanied by lower volume (than when the price was moving trending direction), which signifies trend reversal is a temporary one and the original trend is still strong and will continue once the pullback is over.
Further, a sharp price movement accompanied by high volume signifies that the trend is weakening and a trend reversal is in the offing.
An extraordinary increase in volume in a given session may indicate exhaustion is setting in and hence, be ready for trend reversal.
However, volume alone may not indicate much or may give wrong signals. Also, using this tool, you cannot extrapolate future prices. Therefore, it should always be considered along with price and other indicators. So, volume data should be considered as a supplementary tool and should be used along with other tools.
Volume Profile
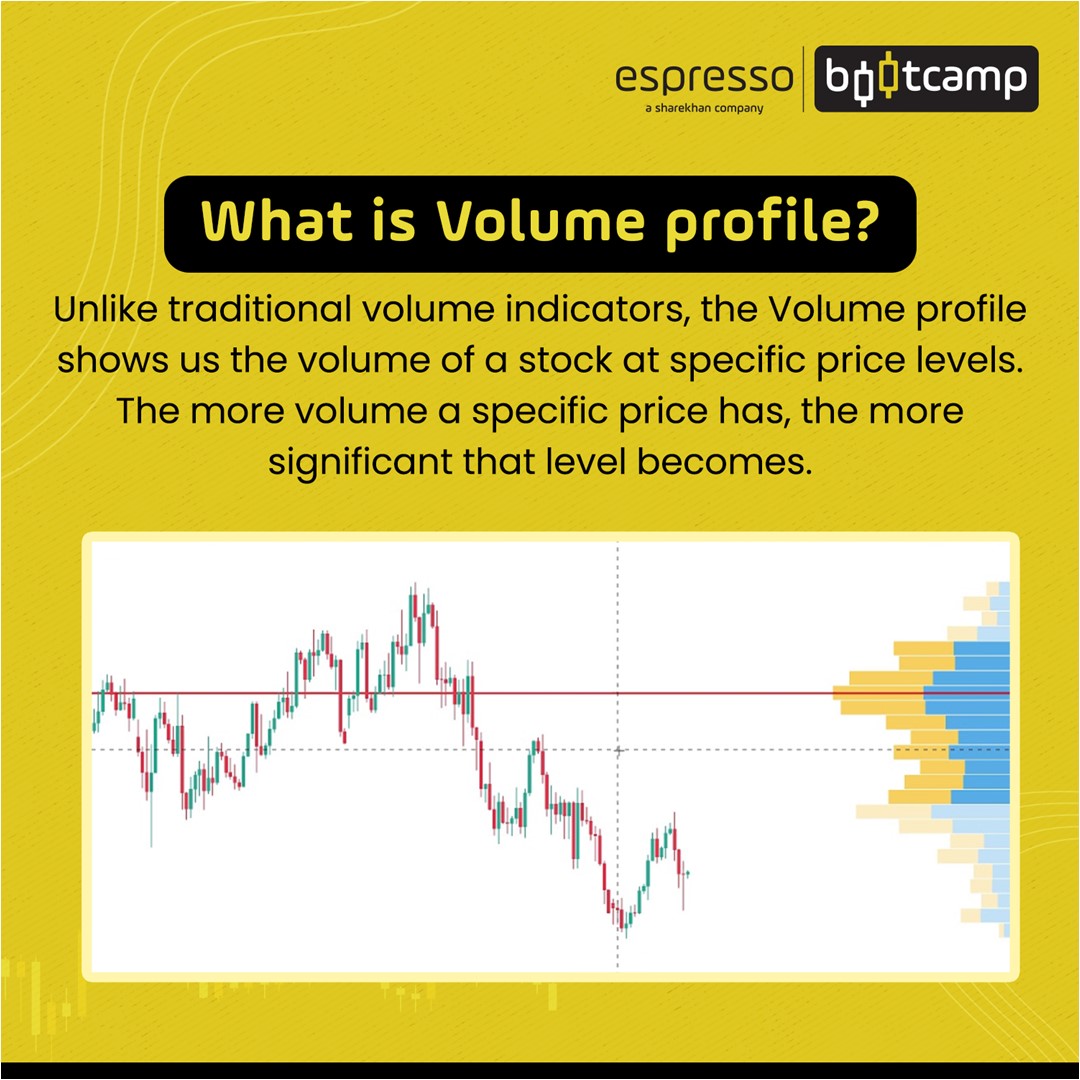
Now let's try and understand what is volume profile in technical analysis, and how do you use volume profile in technical analysis? Volume profile is an auxiliary trader's tool showing the volume traded at a specific price in a given time period. This tool helps to determine the significant levels that a trader should take into account while trading. Volume profile is more popular in forex trading though it can also be used in other markets like stock markets, commodity markets, and spot and futures markets.
Volume profile in stock market is also known as horizontal volumes, which shows price levels at which traders (market participants) made the maximum number of trades. It’s called horizontal volume, as the histogram giving the volume is shown horizontally in the graph. Horizontal volume is different from vertical volume in the sense that the latter shows a number of trades (volume) for a certain period of time and not at certain price levels. On the other hand, the volume profile gives details of how many shares or futures contracts are traded at each price level during a session.
The longest bar (often known as the Point of Control) represents the strongest and the most significant level, which makes the task of identification easy. This bar helps you determine the point of entry and exit and also stop loss. This bar can also help in identifying the support and resistance zones. However, in such cases, it is better not to use volume profile in isolation but along with other techniques.

Given above is the Volume Profile of Reliance Industries’ daily price chart. It clearly indicates the Point of Control bar where the highest number of trades have taken place. While daily volume data takes into account the time period, the Volume Profile considers only the price levels.
Points to remember:
- Volume refers to the number of shares traded.
- Volume can help one find out the liquidity of a particular stock.
- Trend continuation and pullbacks can also be identified with the help of volume.
- Volume profile helps in knowing the traded volume at a specific price.
 0
|
0
|
 0
0

