
 Watch
Watch Moving averages in technical analysis are significant as they help to smoothen out short-term fluctuations in the time series data and show the long-term trend of the series. It is this quality of moving averages which prompts technical analysts to use this statistical tool.


Moving average is a statistical calculation that helps to create a series of averages of different subsets of a full data set. The subsets consist of a fixed number of items in the time series, which move through the series by dropping the top items of the previously averaged subset and adding the next in each successive average.
Let’s do the math
| Date | Day | Closing Price | 5-Day Moving Average |
|
16-May-22 |
1st |
82 |
- |
|
17-May-22 |
2nd |
86 |
- |
|
18-May-22 |
3rd |
85 |
- |
|
19-May-22 |
4th |
80 |
- |
|
20-May-22 |
5th |
83 |
83.2 |
|
23-May-22 |
6th |
74 |
81.6 |
|
24-May-22 |
7th |
74 |
79.2 |
|
25-May-22 |
8th |
71 |
76.4 |
|
26-May-22 |
9th |
74 |
75.2 |
|
27-May-22 |
10th |
74 |
73.4 |
|
30-May-22 |
11th |
75 |
73.6 |
|
31-May-22 |
12th |
76 |
74 |
The above table has the closing prices of SAIL, rounded off to the nearest rupee for 12 trading days to calculate the 5-day moving average. In other words, a 5-day data subset is being used to calculate the moving average.
The first moving average is calculated for May 20 by adding prices from the first to fifth day, i.e., May 16 to 20, and dividing the total by 5.
For May 23, the price of the first day is excluded, the price of the sixth day is added, and the total is divided by 5.
Similarly, for the seventh day, the price of the second day is excluded and the price of the seventh day is added, and the total is divided by five.
This process goes on till the last day. In other words, for any given day, the latest data will be considered, while the oldest data will be excluded. In this case, we have considered only the closing price of the stock. We can also use any other price point, such as opening, high or low. Calculating the closing price is most useful.
Remember: This technique can be used for intra-day purposes, for example, a 5-minute subset for calculating the moving average.
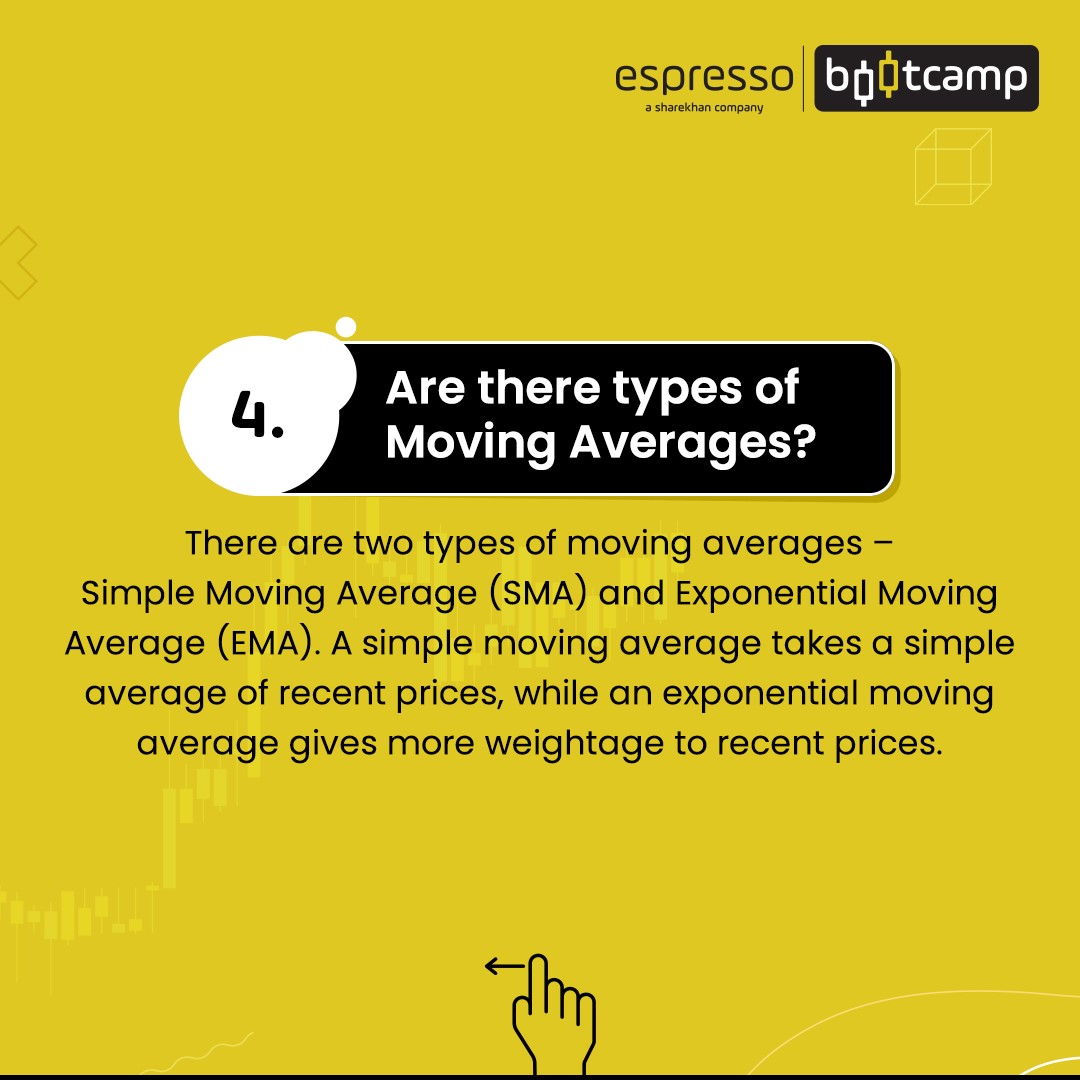
Types of Moving average – Simple vs Exponential
There are two types of moving averages. A moving average can be either simple or exponential. Of course, both types serve the same purpose, that is, measuring trend direction over a period of time.
The moving average calculated in the above example is the simple moving average (SMA), where equal weight is given to stock prices on different dates.
On the other hand, in the case of exponential moving average (EMA), more weight is given to data that is more recent.
EMA is calculated using the following formula:
EMA = (K x (C - P)) + P
Where - C = Current Price; P = Previous periods EMA (SMA is used for the first period’s calculations); K = Multiplier
A multiplier uses the number of periods specified in the moving average, which is calculated using the formula [2 ÷ (number of observations + 1)].
In the above example of the 5-day moving average, multiplier would be [2/(5+1)]= 0.33.
Though both types of moving averages are used to identify the trend, EMA helps identify the trend earlier than SMA, as the former gives more weight to recent data. However, EMA is more prone to short-term changes than SMA.
As time progresses, this tool leaves out old data and adds the latest data to the series, thus emphasising the recent number in the analysis. This continuous deletion (of old items) and addition (of latest items) ensure that the analysis is based on recent data.
In the above example, though both types of moving averages follow the same path, they tend to go apart slightly when the market is volatile or widely fluctuating. You can choose either of the moving averages but stick to the same moving average all the time.
Some traders also used smoothed moving average, which does not differentiate between recent and historical data and gives equal weightage to all. Further, this method does not refer to any fixed period as it takes all the data series into account.
In this case, the daily moving average is calculated by subtracting the prior period's SMMA from the current period's price. Adding this result to the previous day’s smoothed moving average gives today’s moving average. Remember, the first value for the smoothed moving average is the simple average of the price for a given period.
Benefits of moving averages in stock market
Identifying S/R levels
- Moving average lines often become key support and resistance levels in technical analysis
- Apart from indicating the trend, moving averages (crossovers) are used by the traders for entry and exit
- Used by short-term, long-term investors and intraday
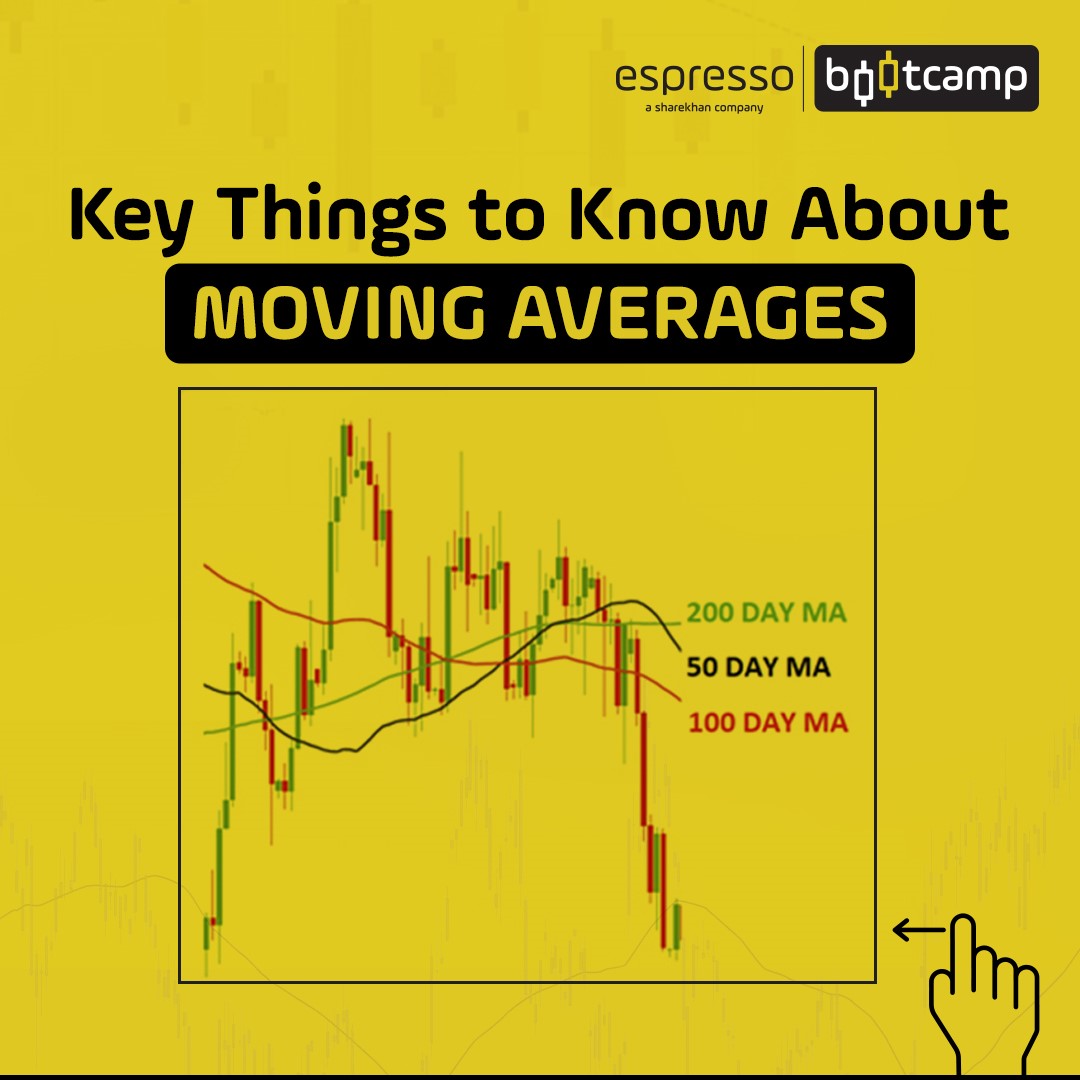
- There are various moving averages – 8-day, 21-day, 50-day, 200-day and so on – which the traders and investors use to identify support and resistance level
Used as per investment strategy
- Selection of moving average depends upon one’s comfort level and investment strategy
- Investors with shorter investment perspectives go for shorter moving averages, while long-term investors use longer duration moving averages for identifying support and resistance levels
Identifying entry and exit points
- Moving averages are used by traders to identify entry and exit points
- When the price chart crosses the moving average line from below to above, long positions are considered
- Breaking of price line from above to below signals weakness and prompts traders to take short positions
- Usually, traders use short-term, say 8 or 21 days, moving averages as trading tools
- Long-term investors usually use a 200-day moving average to decide entry and exit timings
- Alternatively, traders also use multiple moving averages, say, 8-day, 50-day and 200-day, to identify entry and exit points
- When short and intermediate-term averages cross from below to above the longer-term average, it is considered a bullish signal and long positions are taken
- When short and intermediate-term averages cross from above to below the longer-term average, it signals weakness in the market and traders either exit the positions or take short positions
Identifying trends
- Moving averages help identify trends but are not an early indicator
- It identifies trends with a slight time lag, meaning it may not be possible to exit the position at the top nor enter the stock at the bottom
- There is a lot of scope for subjectivity, especially in choosing the time period – 50-day, 200-day, etc., resulting in a varied interpretation
Points to remember:
- Moving averages take short-term price data and smoothen it out to provide a long-term trend.
- EMAs help in earlier identification of the trend.
- Traders and investors can make use of SMA or EMA depending on their investment strategy.
 0
|
0
|
 0
0

