
 Watch
Watch The universal truth is that a stock never (or rarely) opens at a price where it was closed during the previous session. Usually, it opens above or below the previous closing because several events might have taken place between the closing of the previous session and the opening of the current session. Also, the goings-on at international markets, such as those in Europe and the US, also impact on the opening prices of indices and individual stocks.

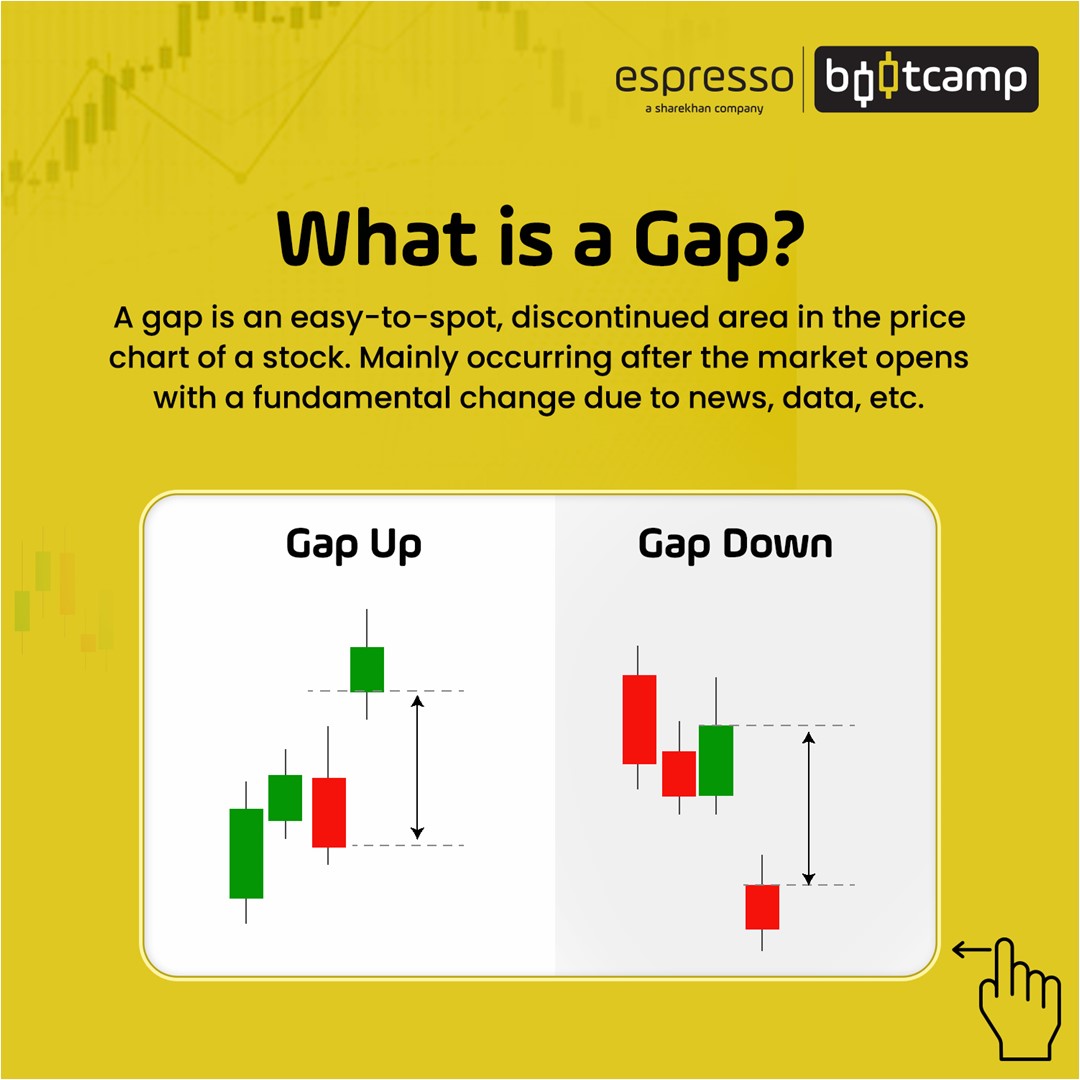
As revealed from the chart above, it is normal to have some difference in the previous closing and current opening - which, in the price chart, results in a gap up or gap down opening. Sometimes such gaps are wide, while sometimes, they are too small even to notice.
Gap up opening is said to have occurred when the current session’s opening is higher than the previous session’s high.
Gap down opening is said to have occurred when the current session’s opening is lower than the previous session’s lowest price.
Bigger gaps often give signals about future price trends – it may be either continuation or trend reversal. Though gaps can happen in daily, weekly and even on monthly charts, it’s more common on daily charts than on other time periods. Between monthly and weekly charts, weekly charts are more prone to have gaps due to weekend closures. Even monthly gap up or gap down openings are possible as some important events having global significance, like OPEC meetings, are sometimes held either at the end of the month or at the beginning of the month, which may also impact opening price stock indices or individual stock prices.
Influencing factors
Due to globalisation, economies around the world have become closely connected – an event in any corner of the world may have an impact on other parts of the world. That may, in turn, impact the local stocks.
Time difference also plays a major role. Indian stock markets are closed when stock markets in the west open. Also, markets in the east, such as Tokyo, North Korea and Singapore, open earlier than our markets. Any violent fluctuations in these markets will impact the opening price of our markets.
Also, some Indian stocks are listed on foreign stock exchanges, say New York or London, and their behaviour overnight in those exchanges will also have an impact on the opening prices.
Further, Nifty is also traded in other exchanges like Singapore, and since the Singapore stock exchange opens much earlier than our exchanges, it impacts the opening quotes.
Quarterly results announced before the opening bell or after the closing of the market (affecting the next day’s opening price) may also result in stocks opening with gaps.
Events such as major policy announcements, natural calamities, war, etc., occurring after market hours may impact the next day’s opening price.
Types of gaps
Though it is easy to identify gaps, it is very difficult to determine their types.
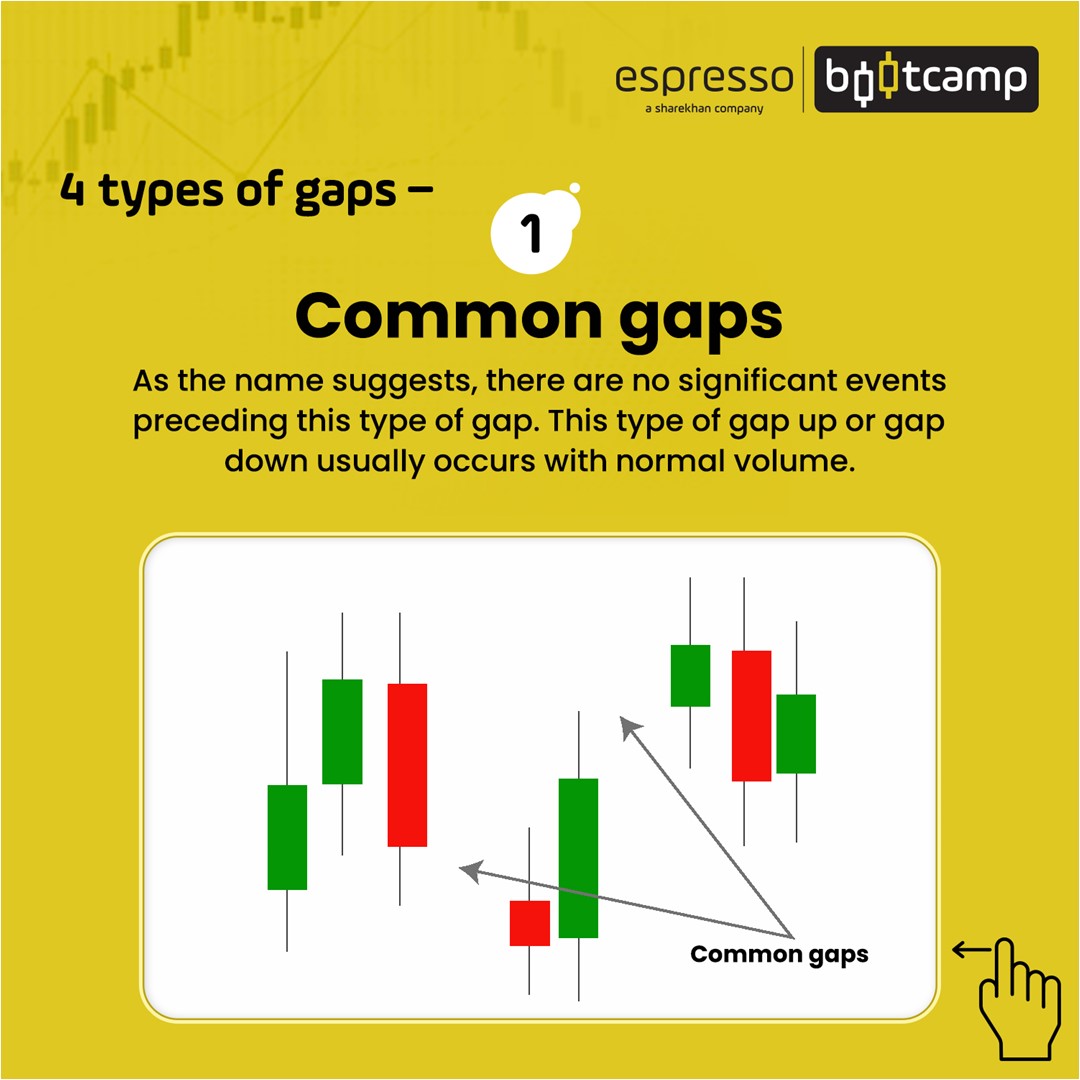
Common Gaps
As the name suggests, these gaps happen routinely without any major reasons and are usually uneventful. Such gaps are found more on intraday charts than on daily charts, as they often get filled up during the trading session. Many intraday traders lookout for such gaps (either in index or individual stocks) and make quick profits.
Usually, by monitoring of pre-opening price of stocks and indices, traders take advantage of the prices opened with gaps. Such gaps usually occur in lower volume or in trading zones, which the traders quickly try to take advantage of. In such trading strategies, deciding on stop losses and strictly following them also plays an important role.
In the above 5-minute chart of HDFC, the common gap up got filled up within 30 minutes of its occurring. You won’t be able to see such gaps on the daily chart as they get filled up within the session itself.
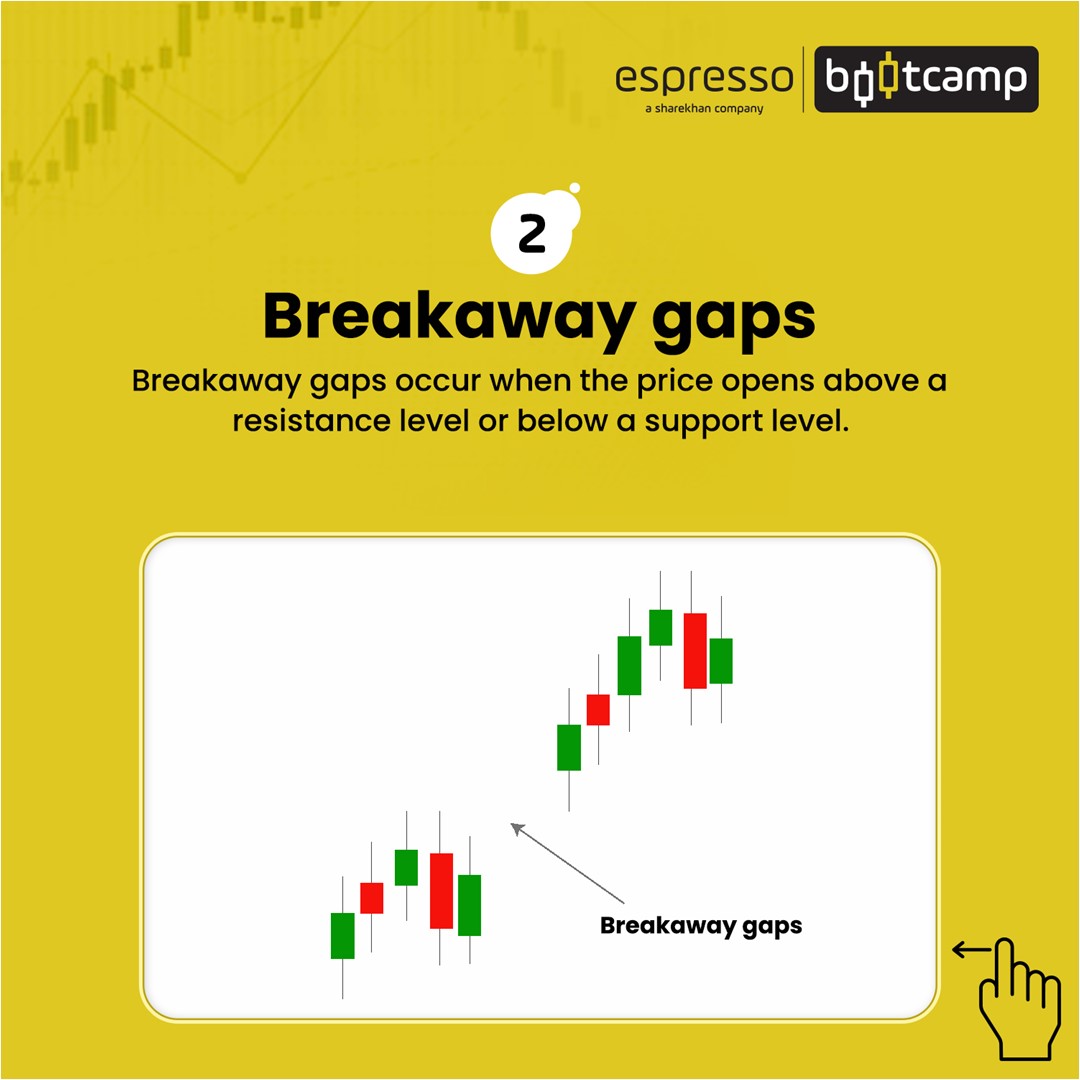
Breakaway Gaps
These are important as they signal a breakout of the price line from the trend. It can be either on the upside (gap up) or downside (gap down). Unlike common gaps, breakaway gaps do not occur routinely, and therefore, their identification is slightly difficult.
To identify these gaps, you need to be well-versed in trendline concepts and should know how to draw and read trendlines. Another important differentiating factor with common gaps is that breakaway gaps usually occur with increased volume. Once the gap occurs, the volume should further increase, which will ensure the validity of breakaway gaps. The volume will increase because unwinding of positions (by those who are on the wrong side of the trade) and the creation of fresh positions.
Such gaps may or may not get filled up. If they get filled up, it may not be immediately but may take much longer time. Also, if the gap gets filled up within a few days, it signals the failure of the breakaway gaps, warranting immediate reversal of positions. In the above Nifty daily chart trendline has been broken with a gap resulting in a breakaway gap.
It should be noted that a breakaway gap, backed by a chart pattern line ascending descending triangle breakout, will be more effective than the normal breakaway gaps.
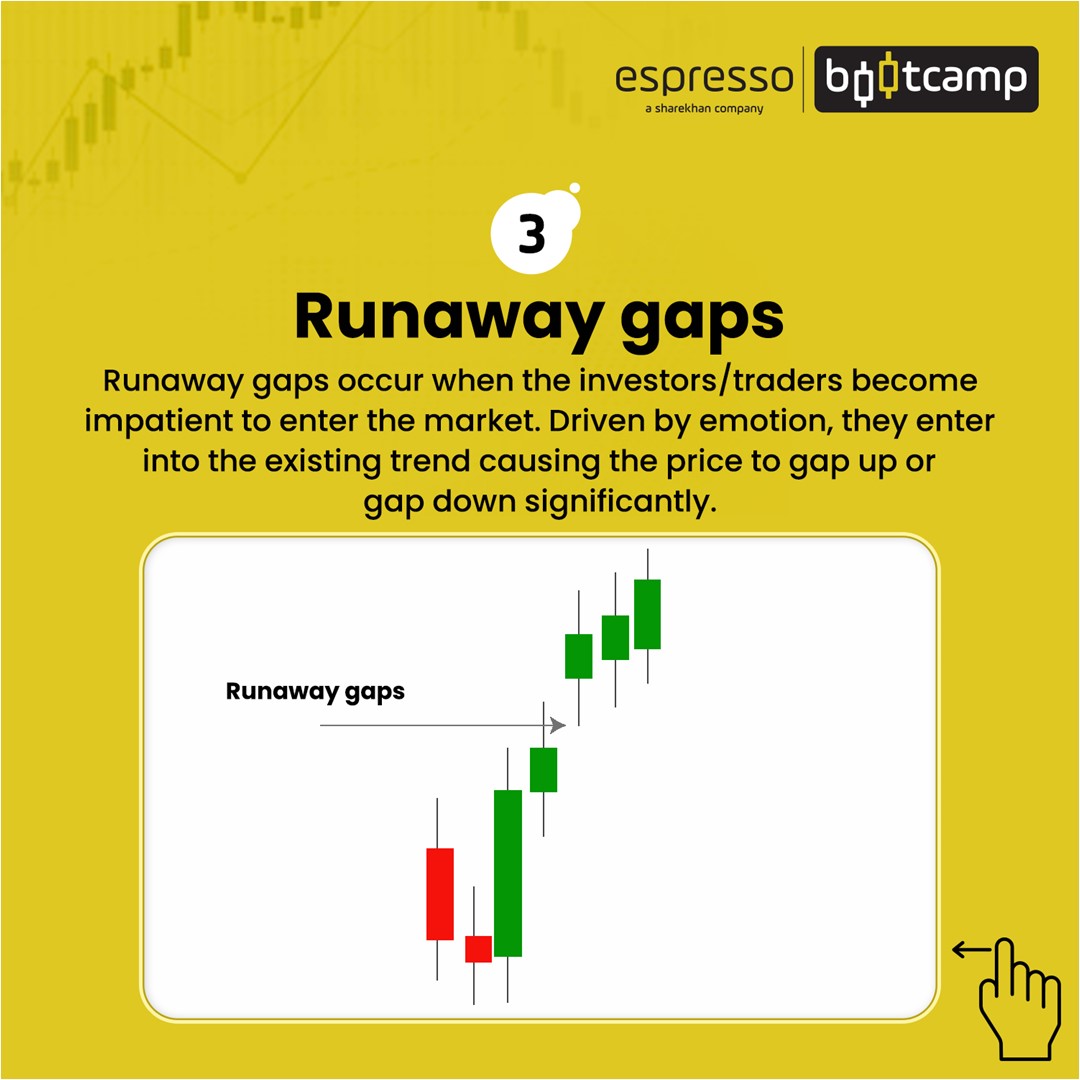
Runaway Gaps
Runaway gaps occur because of a sudden change in the market perception of a stock. Perception may change due to the acquisition of the company by new management, quitting of key management people, change in the government policy, bagging of new orders, etc.
Runaway gaps occur because of the entry of people who missed the initial up movement in stock price. On the downside, they occur because of confirmation of bad news, paving the way for further liquidation of stocks that may ultimately result in panic selling.
An important difference between breakaway and runaway gaps is that while the former often signifies a change in the trend, the latter affirms the continuation pattern. Like breakaway gaps, the filling of gaps may or may not take place, and in the event that it takes place, it won’t happen immediately.
In the above daily chart of Tata Steel, after the occurrence of the runway gap, the downslide continued with increased volume.
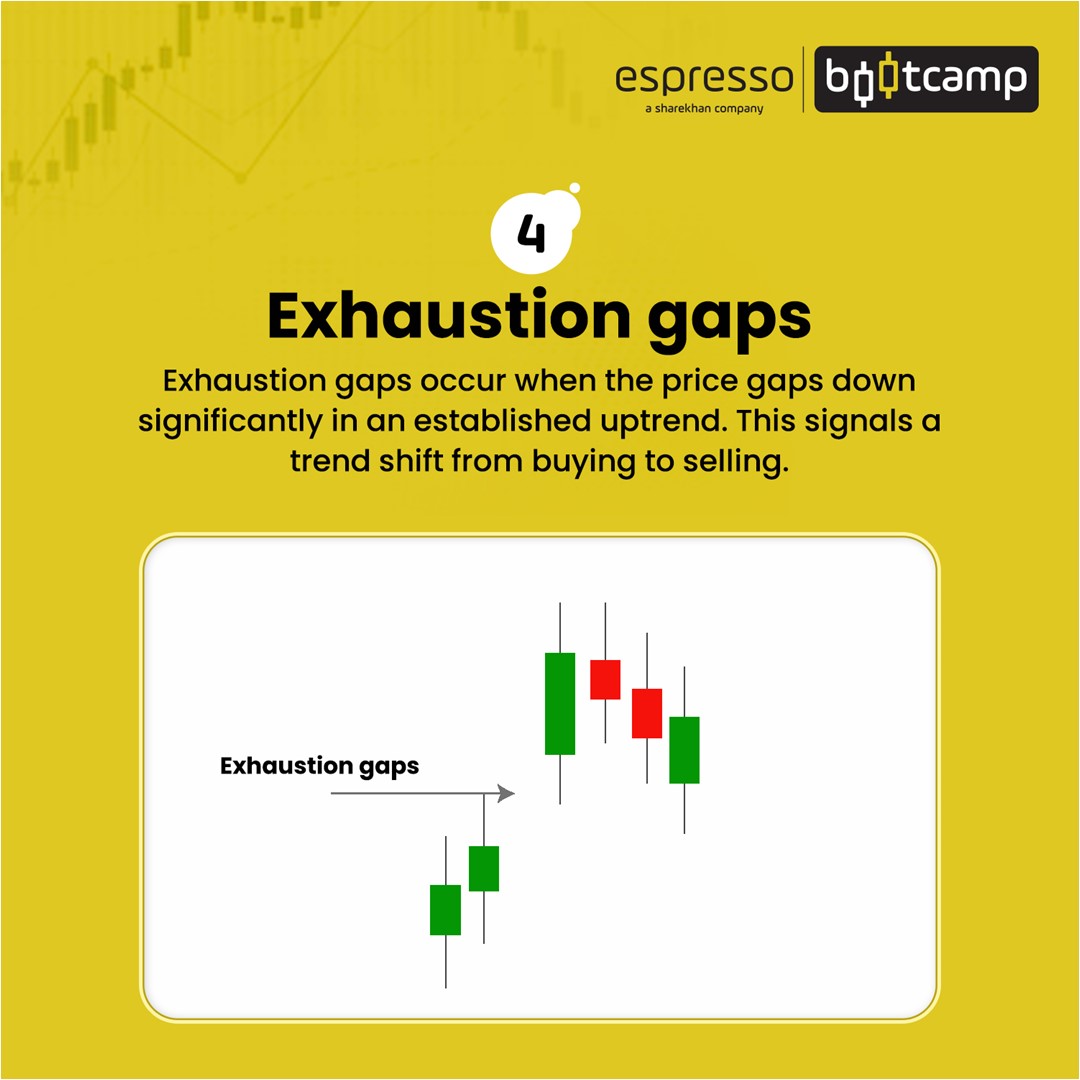
Exhaustion Gaps
Exhaustion gaps take place towards the end of the trend – upward or downward. It may often be confusing and may be mistaken for a runaway gap. The major differentiating factor here is the unexceptionally high volumes in case of exhaustion gaps. Another factor that differentiates the exhaustion gap and breakaway and runaway gaps is that, in the case of the former, the gap is filled up quickly.
It should be noted that the exhaustion gap cannot be identified on the day of its occurrence but later on if supported by increased volumes. Reversal may happen immediately in the next session or a session after.
Gaps can also act as support or resistance, depending upon their positioning. Gap up can act as support when the stock price starts correcting. Similarly, a gap down can act as resistance when the stock price starts moving upwards.
Points to remember:
- A gap-up or gap-down occurs when the opening price is higher or lower than the previous session’s closing price, respectively.
- Breakaway gaps can help in spotting trend breakouts.
- Runaway gaps take place due to sudden changes in market perception.
- Exhaustion gaps usually happen at the end of the trend but traders should be careful as to not confuse it with a runaway or breakaway gap.
- Gaps can provide strong support and resistance.
 0
|
0
|
 0
0

