
 Watch
Watch Cycles are patterns or events that repeat themselves at regular time intervals - can be related to nature, weather, economy, sector, and stock markets.
Just as nature’s cycle drives the changes in weather conditions forming the spring-summer-autumn-winter, cycle theory in the stock markets context states that the movement in prices is governed by cyclical forces.

Note:
- All markets are cyclical
- Common phases include:
- Rising cycle
- Reaching their cyclical peak
- Dipping cycle
- Bottoming out
- Once the four phases of a cycle are complete, the next cycle begins
Technical experts use time and price cycles to arrive at the cycle length, estimate the cycle lows for the future and arrive at turning points.
Phases of cycles in stock markets
Technically speaking, a market cycle is usually categorised into four phases. Let’s understand them in detail:
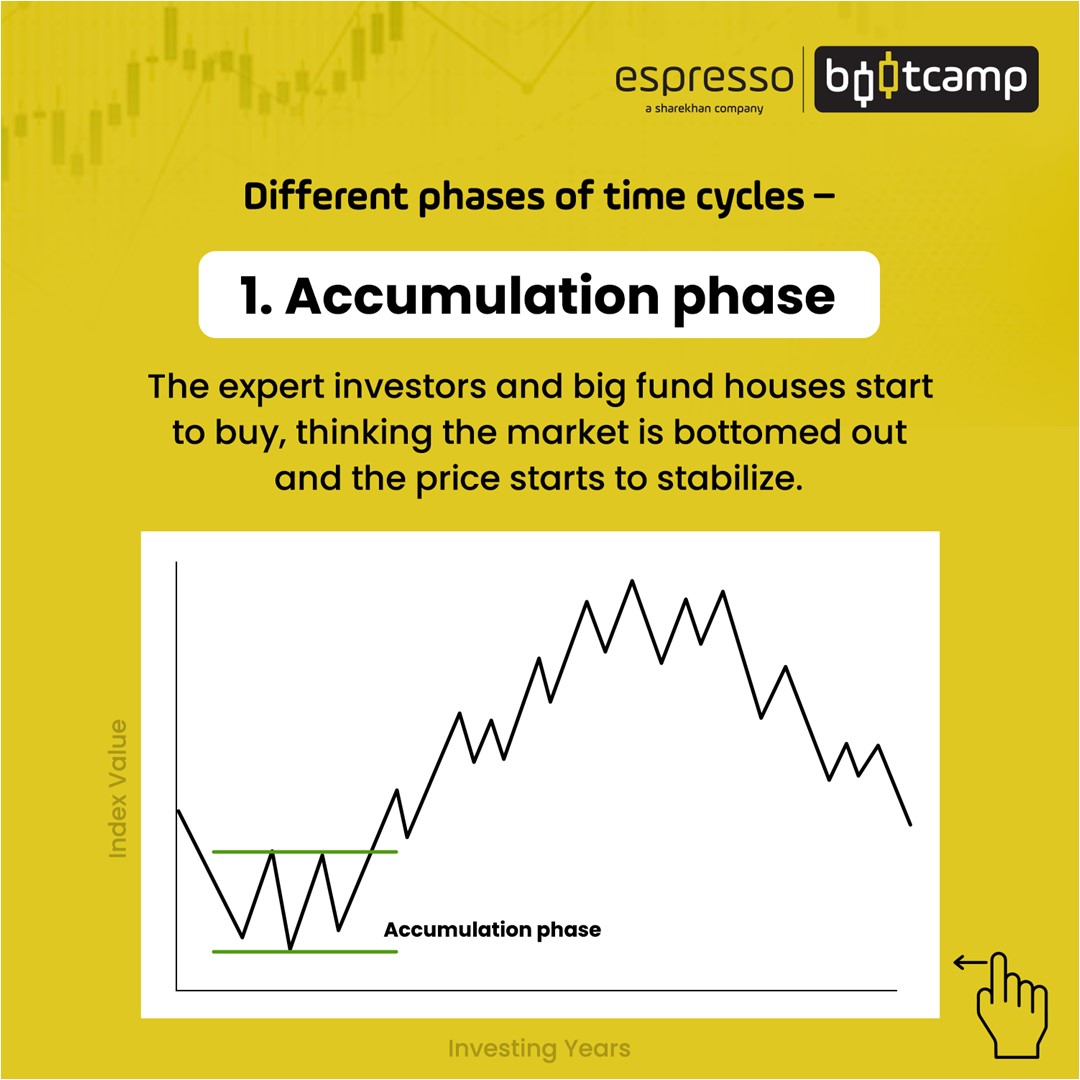
1. Accumulation Phase
This refers to the period when the market has bottomed out. This is when investors are bottom phishing and looking for value buys in the hope that markets have moved passed their worst.
Indicators:
- Valuations of securities generally become reasonable after the correction
- Bearishness and negative sentiments are still predominant
- Even staunch optimistics begin to run out of patience and start exiting despite weathering the storm for a long time
- Prices move in a flat range
- Buyers get securities at a heavy discount
- Market sentiment begins to shift from negative to neutral
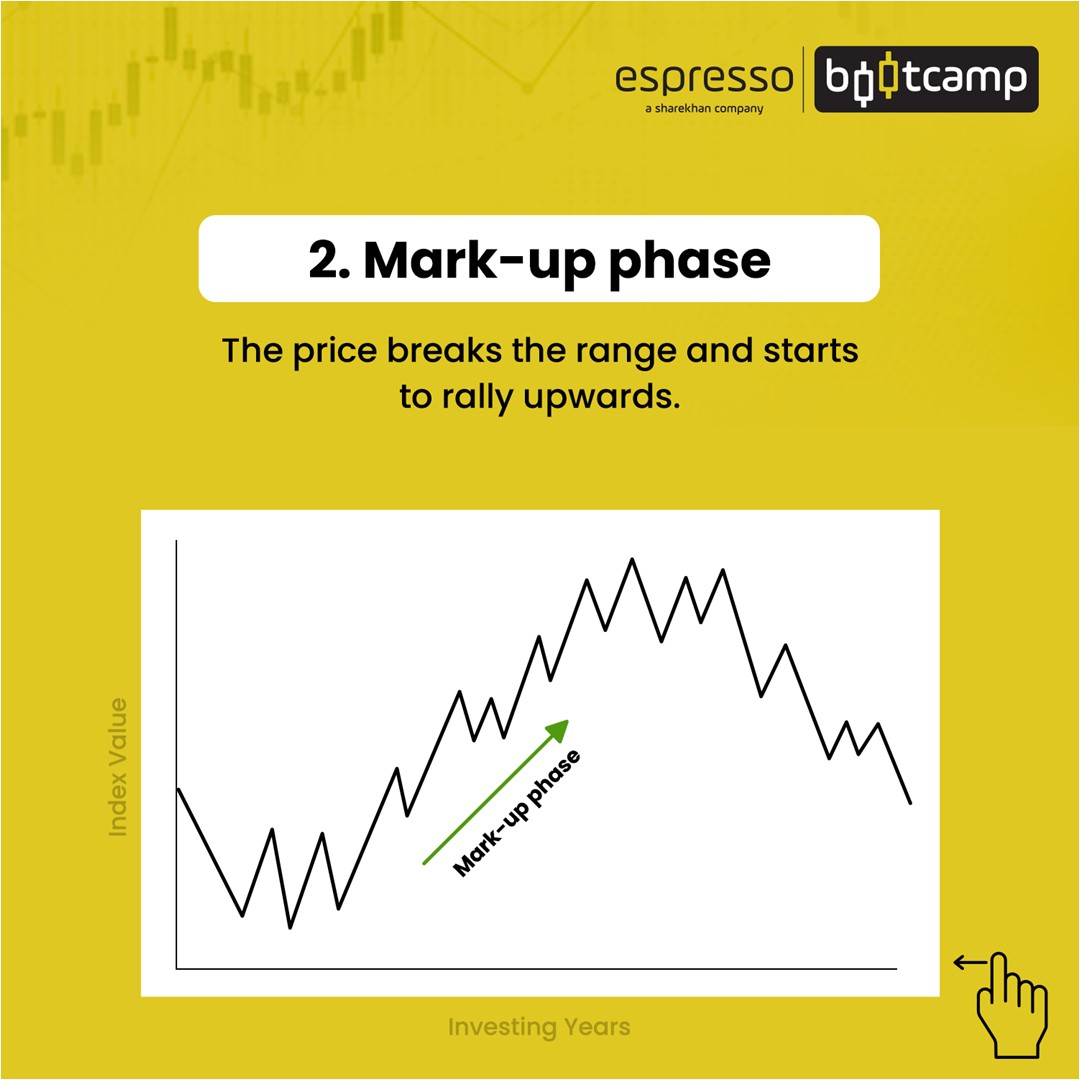
2. Markup Phase
This is the phase where markets begin to look up after remaining stable for a while. Technical traders begin to see the changes in trend and lap up the stocks before they begin their run-up. It is also the point where greed takes over, and by the last leg of this phase, the vast majority of investors pour in, and the markets witness a substantial jump in volumes. It is usually the time when inexperienced investors jump in while the seasoned ones offload their positions.
Indicators:
- Prices soften with a slight slowdown
- Surge in buying almost immediately
- Prices begin to rise again
- Selling climax in which the largest gains are made in a short time
3. Distribution Phase
During this phase, the market sentiments are a mix of bullish and bearish. Bears become dominant, wrestling bulls to keep the prices in a range.
Indicators:
- Markets tend to trade in one range for days and months together
- Market direction changes once this phase is over
- The process can be swift if there is negative news about the global economy or certain geo-political developments
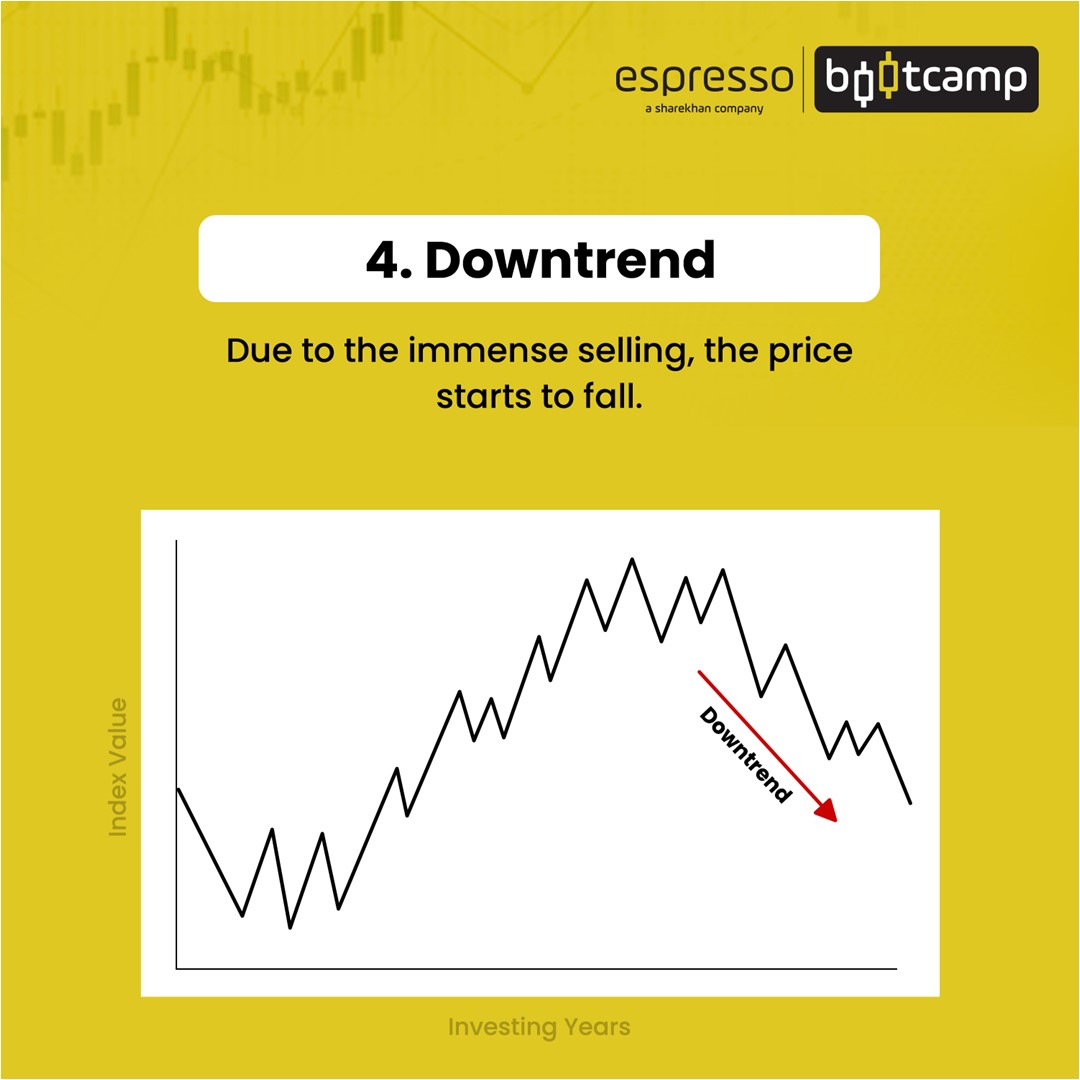
4. Markdown Phase
The last phase of the time cycle sees several investors going bust. These investors are typically those who have been holding onto their investments for a long as they have now moved below their purchase price. They had been hoping for a reversal, ultimately losing patience and coming out of the investments after incurring huge losses.
Indicators:
- Markets bottom out, which technical experts can identify
- They begin to make fresh investments
There are some more cycles/phenomena that you need about :
Presidential Cycle
There is one more cycle or phenomenon which has lasting effects on market cycles. It covers a gamut of assets such as stocks/equities, real estate, commodities and bonds. This is famously known as the presidential cycle, as it revolves around the effects of Presidential elections.
The four-year term of a President is marked by economic sacrifices in the first two years. As fresh elections draw closer, the President gives a mandate to their administration to do all they can to put the economy in top gear, giving them another shot at the chair for another four years.
Gann Cycle
This trading technique was developed by trader William Delbert Gann in the early 1900s in the US. He based the foundation of his technique on time and price analysis, making it easier to not identify a change of trend and give a fair idea about the entry and exit price. He used the Natural Law theory and geometric proportions, based on the circle, square and triangle, which gave a reasonably accurate picture of how the market trend is changing.
Points to remember:
- Understanding market cycles can play a huge role in deciding on the nature of an investor’s journey
- It may be noted that cycles exist in financial markets, but they undergo changes over time, so much so that they sometimes even disappear for some time
- This is a challenge for traders as they sometimes do not expect the current phase of the market to end
- Another challenge is traders are rarely able to pick the exact top or bottom of a cycle despite their experience
- Challenges notwithstanding, a fair bit of understanding of cycles is a potent weapon to run the tide and earn maximum rewards
 0
|
0
|
 0
0

