
 Watch
Watch Put call ratio or PCR, as it is known in the world of options trading, is a ratio that gauges the mood swings of the market. It is a ratio that compares the put activity vis-à-vis the call activity.
 Put options are the right but not the obligation to sell a specified amount of the underlying and call options are the right but not the obligation to buy a specified amount of the underlying. When the put activity is seen as a proportion to the call activity it tells us which of the two is overpowering. If the ratio is greater than 1, it would mean that the puts are stronger, suggesting the market is turning out to be weak. And if it is less than 1, then calls are stronger, suggesting that the market is turning out to be strong.
Types of PCR
PCR is calculated in two ways — based on volume and open interest. Based on volume, PCR is the total traded volume of puts divided by the total traded volume of calls. Based on open interest, PCR is the aggregate option position of put options divided by the aggregate open positions of call option. One cannot simply go by the ratio. It is important to compare the current PCR with the past PCR to know if the PCR ratio is indicating too bearish a sentiment or too bullish a sentiment.
The above table shows the total open interest for calls and puts and the total volume for calls and puts.
Let us calculate the volume PCR and OI PCR:
Volume PCR= Total put volume / Total call volume
= 2,06,84,932/ 2,23,57,500
= 0.93
OI PCR = Total put open interest / Total call open interest
= 14,50,797 / 21,12,999
= 0.69
How to read PCR
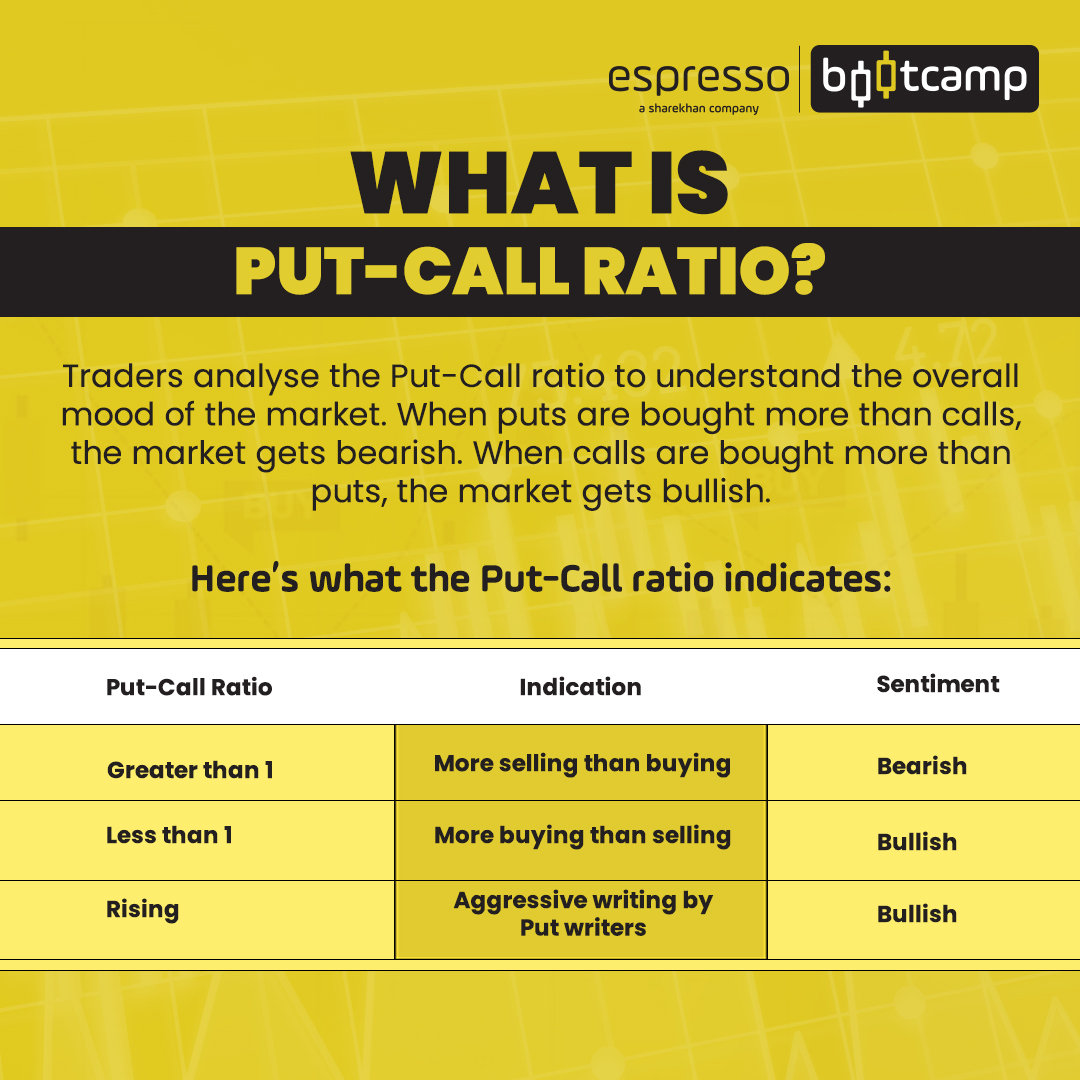
There are two ways of reading the PCR — the standard way and the contrarian way. A PCR greater than 1 is an indicator of bearish sentiment. This is because more puts are being bought than calls, and therefore, the market is turning negative. On the other hand, a put call ratio less than 1, say around 0.70, indicates more calls are being bought, indicating a bullish sentiment and the market is turning positive. This is the standard way of reading the PCR.
The contrarian way is like an overbought and oversold technical indicator. An overbought situation is when a stock is making successively higher highs and an oversold situation is when a stock is making successively lower lows. In an overbought and oversold situation, a trader takes a contra position, i.e., he will start buying when the market or the underlying is oversold and sell when the market or the underlying is overbought.
In the contrarian PCR view, a trader would do the opposite when the PCR has reached an extreme. The trader would change his view to buying when the PCR has reached an extreme of, say 1.5. Similarly, the trader would change his view to selling when the PCR has reached an extreme, say 0.50.
A different take on PCR
The standard interpretation goes by the logic of buying of options. Yet another PCR approach exists, which is opposite to the normal view and is based on the selling of options. This approach believes that option writers are better informed, and that this is done by institutions and hedge funds which have deep pockets. They also employ complex strategies to take a bet on the market and hedge their portfolios by writing calls and puts. Therefore, writing puts means having a bullish bias leading to more put activity, and writing calls means having a bearish bias leading to more call activity. Therefore, an increasing PCR means it is a bullish view and a decreasing PCR would mean a bearish view.
This apart, institutions buy substantial quantities of stocks as part of their investing activity. To hedge these long portfolio positions, they buy puts simultaneously creating long hedges, and therefore, increased put activity leading to increased PCR. On the other hand, when they book profits in their long positions, they hedge it by creating short hedges by buying calls resulting in increased call activity and leading to a decrease in PCR.
Summing up
PCR is by no means an indicator that generates a trading signal. But it does give a broad direction of the underlying, and therefore, is used for directional trades. It is also used as a contrarian indicator for trading at the extremes. It is much safer to take a bet when the PCR reaches an extreme, i.e., when it has breached its average zone for a period. It is important to read and evaluate the historical PCR value of stocks and indexes independently as extreme PCR values for both of them are different. A PCR reading of the index at 1.3 may be extreme for an index. However, the same reading may not be extreme enough for a stock. All said and done, it is not easy to read and trade with PCR as a standalone indicator. One has to consider other parameters while considering PCR as an additional tool for interpretation rather than initiating a trade.
 0
|
0
|
 0
0

