
 Watch
Watch All listed companies are required to declare their financial performance every quarter. These reports are called the quarterly report or quarterly results and they help investors understand the progress a company makes towards its annual and long-term goals. It also helps them take a call if it is worth staying invested or exiting when the company is not staying on course. Learning how to read quarterly results will prove to be an asset for you if are looking to dabble in stock markets.
A quarterly report consists of an unaudited statement of profit and loss along with segment results. Companies are mandated to include their six-month (the quarter ended and the preceding quarter) and Year to Date figures of the current year results in the balance sheet and cash flow statement as well. It is also mandatory to declare the quarterly report as per the listing clause agreements with the stock exchanges.
Quarters, meaning and representation
A financial year is different from a calendar year. While the calendar year begins in January, the financial year begins in April. There are four quarters in a financial year for which a company needs to provide a quarterly report. Here are the details:
- Q1 (April-June)
- Q2 (July-September)
- Q3 (October-December)
- Q4 (January-March)
A company declares quarterly results in stock market every quarter, apart from the half-yearly and annual results. The half-yearly result is declared in Q2, while the annual result is declared in Q4. Year to Date (YTD) results of six and nine months help in examining the progress of a company's performance. The YTD for Q2 will be half-yearly, and for Q3, it will be the nine-month report. The time limit for declaring the results are 45 days from the end of the quarter for Q1, Q2 and Q3. For the last quarter, the time limit is 60 days.

How to read quarterly results
A quarterly report can be examined or analysed by comparing the current quarter result with the sequential previous quarter result, known as quarter-over-quarter (QoQ), and with the corresponding quarter of the previous year, known as year-on-year (YoY).
For example, if Q3 quarterly results are announced for the financial year 2022 (FY2022), QoQ will be Q2 of FY2022, and YoY will be Q3 of FY2021. An example of driving home the point is as follows:
Comparing QoQ and YoY will help understand if the company is growing. Both QoQ and YoY are important aspects for comparing the results.
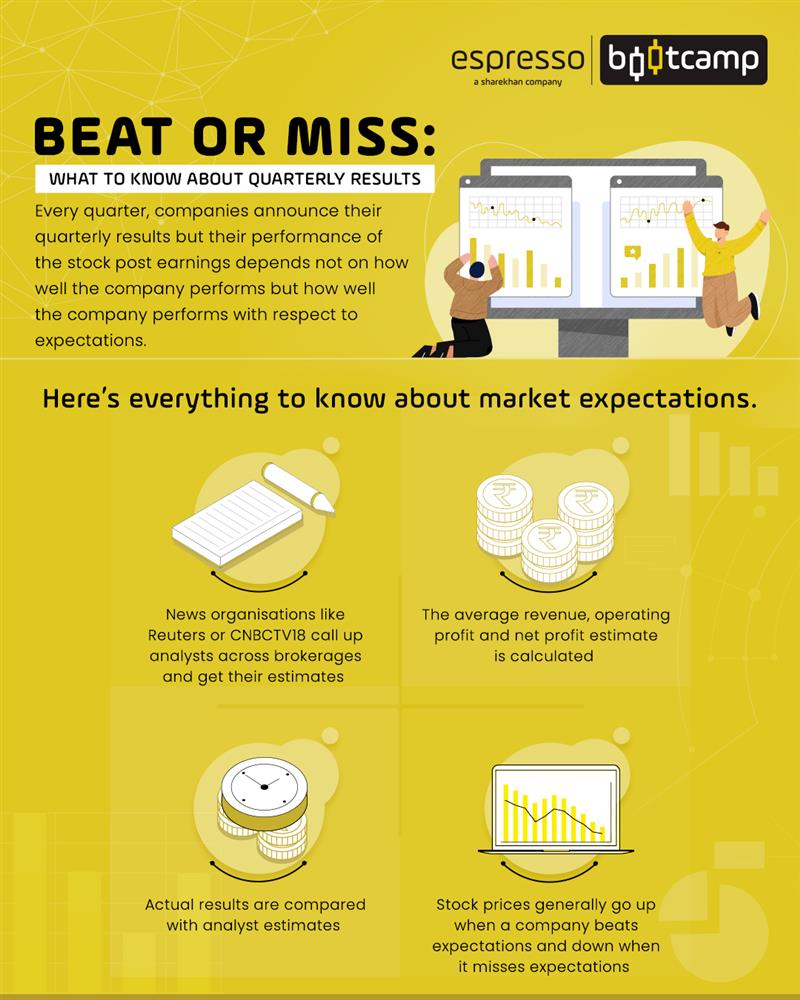
Another key aspect of being aware of is the market or analyst expectations. Multiple analysts track a company, and they make their growth estimates for the quarterly report of a company. The average of these estimates is known as market expectations or consensus estimates. Stock prices get influenced by analyst expectations. If the results beat the market expectations, it reacts positively and negatively if it falls short of expectations.
Structure of a quarterly report

The Securities Exchange Board of India (SEBI) has prescribed the formats for declaring quarterly results. It is divided into the following sections:
Analysis of quarterly results
Analysing a quarterly report involves examining various sections of the results, as described in the above image.
Income analysis: This section of a quarterly report contains income from operations and other income. Income from operations needs to be compared QoQ and YoY to determine the trajectory of the growth.
For example, in the image given above, we can see that the income from operations for Q3FY22 at Rs 5707.47 crore has increased as compared to Rs 5073.32 crore in QoQ and Rs 5194.66 crore YoY. It helps in understanding growth in terms of percentage. The income from operations has grown by 12% QoQ and 9.87% YoY. On a YTD basis, the income from operations has grown by 24.23%.
The growth formula is (Current number/previous number-1) X previous number.
Expenditure analysis: Similar analysis has to be made for key expenditure items such as cost of raw material, employee salary, operating expenses and other expenses, etc. Any sharp increase or decrease in expenditure should be examined, and possible reasons need to be investigated.
For example:
- Cost of raw materials: In the above example, the cost of raw materials has increased both YoY and YTD by 27.68% and 68.24%, respectively. On the other hand, the cost of raw materials has decreased in QoQ by 5.58%. Since the company belongs to an industry whose raw materials are derivatives of crude, the cost has increased due to the rapid increase in crude oil prices.
- Other expenses: These have seen an increase in QoQ and YoY by 8.12% and 14.95%, respectively. On a YTD basis, it has increased by 28.88%.
Profit analysis: In a multi-fold analysis, one has to examine profits at different levels to understand how the company is performing at the operating level – whether the profits are enough to cover interest and taxes and if profit after tax is left to the shareholders. Profits have to be analysed similarly concerning growth as done for income. One must understand that only regular expenses and incomes are only to be taken for analysis and extraordinary incomes and expenses have to be excluded. The increase or decrease of the following profits needs to be examined and the reasons investigated.
- Operating profit: Derived from the core operations of the company. It is calculated as:
Total revenue minus total operating expenses
Expenses will not include depreciation, interest and taxes, and other income will also be excluded.
- Earnings before interest and tax (EBIT): Derived by deducting all expenses, except interest and tax from total revenue
- Profit before tax (PBT): Derived after deducting all expenses from revenue except taxes
- Profit after tax (PAT): Profit after deducting all expenses, including tax
Profitability analysis: Profitability is a ratio of two elements from the income and expenditure statement, namely revenue and profits. It conveys if the growth in revenue or profit is because of a decrease in margins or volumes. The higher the margin, the better it is. Profitability is also a multi-fold analysis as you need to examine and analyse profitability at various profit levels:
- Operating margin is a ratio of operating profit to revenue from operations. An increase and decrease in the margins need to be examined. An increase in margin implies the company has taken a price increase, and this may, in turn, affect volumes. A decrease may imply the company has taken a price cut, and volumes may have improved. The causes for both need to be examined
- EBIT margin is a ratio of EBIT to revenue. This indicates the percentage of profit available to cover interest and taxes. An increase in margin means the profits are getting better to cover interests and taxes, and vice versa for a decrease
- PBT margin is a ratio of PBT to revenue and indicates the margin before taxes are paid
- PAT margin is a ratio of PAT to revenue and indicates the margin that a company makes after all expenses are paid. It is the most important as it shows the efficiency of a company running the business.
Other comprehensive income or loss: These are items included in the quarterly report where unrealised incomes and gains are recorded, which are informative and have to be noted.
Total comprehensive income: This is the total of both profits and comprehensive income, which is transferred to the shareholder’s fund.
Paid-up equity capital and earnings per share: Equity capital outstanding, face value and earnings per share (EPS). EPS is the most important indicator as it measures the profit per share that accrues to the shareholder. The higher the EPS, the better. One must consider diluted EPS as it takes into account all future convertible securities for calculating EPS.
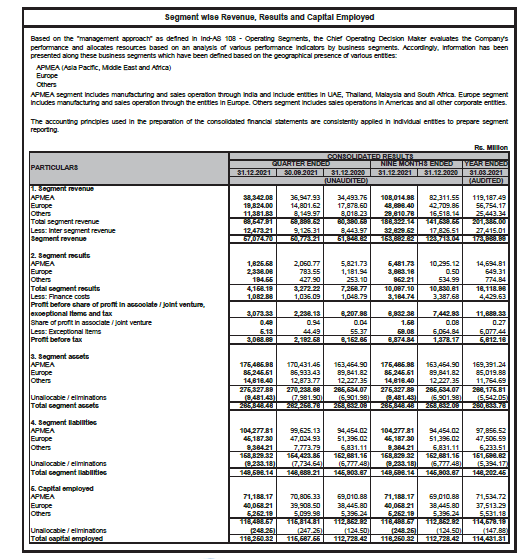
Segment results
Segment results form part of the quarterly results. It discloses the key business segments that a company operates in and could either be on a product-based segment or a geographical location. This helps stakeholders understand which segment is efficient in terms of revenue, profits or return on the segment-wise capital employed.
All of the above analyses can be applied to segment results.
Points to remember
- It is important to analyse quarterly, half-yearly and nine-month reports or results of a company
- Investors, traders and shareholders can monitor the progress of a company's performance
- Quarterly segment results also need to be studied to get important insights into the working of a company.
 0
|
0
|
 0
0

